
사전구축
이전 AKS front + back 서버 구축(2)을 마친 이후에 작업을 진행해도 되지만 굳이 안해도 상관없는 내용입니다. AKS 클러스터 생성과 노드 확인후 credentials을 얻은 후에 노드를 확인했다고 한다면 큰 문제 없이 진행될 것입니다.
현재 window환경에서 작업 중입니다.
구축
모니터링 시스템을 구축하기 앞서 먼저 helm을 설치해야 합니다. 윈도우 pc의 경우 helm을 설치하기 위해 패키지 매니저인 chocolatey를 설치한 이후 kubernetes-helm을 인스톨 하는 방식으로 진행합니다.
helm설치
1. PowerShell 관리자 모드 실행
2. Get-ExecutionPolicy (만약 Restricted라면 AllSigned나 Bypass로 설정)
2.2. Set-ExecutionPolicy AllSignedSet-ExecutionPolicy Bypass -Scope Process
3. Set-ExecutionPolicy Bypass -Scope Process -Force; [System.Net.ServicePointManager]::SecurityProtocol = [System.Net.ServicePointManager]::SecurityProtocol -bor 3072; iex ((New-Object System.Net.WebClient).DownloadString('https://community.chocolatey.org/install.ps1'))
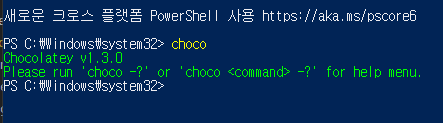
4. choco설치 완료후 choco를 입력했을 경우 아래와 같이 나오면 성공입니다. 만약 이상이 생긴다면 chocolatey의 공식 홈페이지로 이동하여 설치 방법을 다시 확인하시면 됩니다.
이후 choco를 이용하여 helm을 설치합니다.
helm 설치

choco install kubernetes-helm

helm version
설치 완료 이후 helm version을 이용하여 설치를 확인합니다.
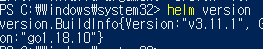
위와같이 version 정보가 출력되면 설치가 완료된 상태입니다.
이제 간단한 모니터링 시스템을 구축하시면 됩니다. 모니터링 시스템은 prometheus와 grafana를 이용하게 됩니다.
Prometheus 및 Grafana용 Helm 저장소 추가
helm repo add prometheus-community https://prometheus-community.github.io/helm-charts

helm 업데이트
helm repo update

aks에 그라파나, 프로메테우스 배포
helm install prometheus prometheus-community/kube-prometheus-stack --namespace monitoring --create-namespace

설치 확인
kubectl get all -n monitoring
prometheus의 helm 차트가 궁금하신 분은 prometheus-community/helm-chars에서 확인이 가능합니다.
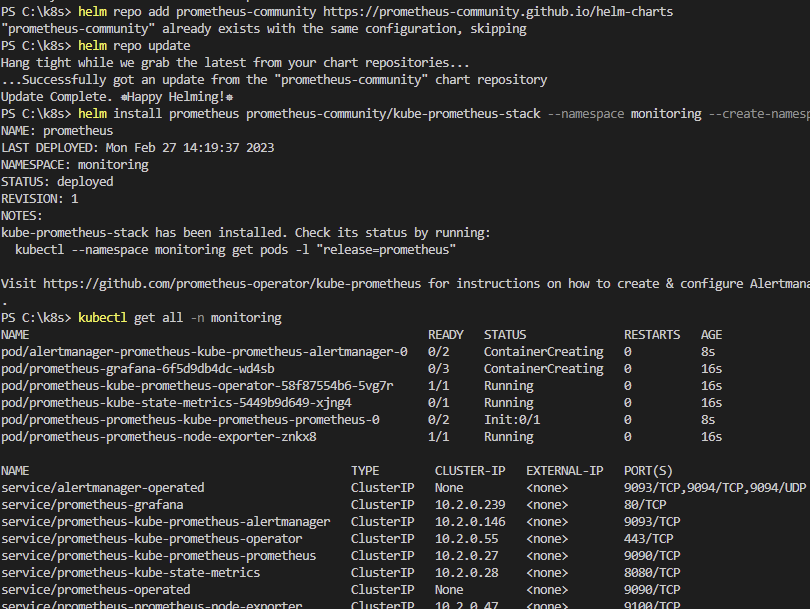
위와 같이 나오면 성공입니다. 이제 prometheus와 grafana로 접속하여 확인하도록 합니다.
그라파나 접근
kubectl port-forward svc/prometheus-grafana -n monitoring 4000:80 # (localhost 로 접근가능)

- id : admin / passwd : prom-operator
이후 데시보드 확인

prometheus 접근
kubectl port-forward svc/prometheus-kube-prometheus-prometheus -n monitoring 4001:9090 #(localhost 로 접근가능)
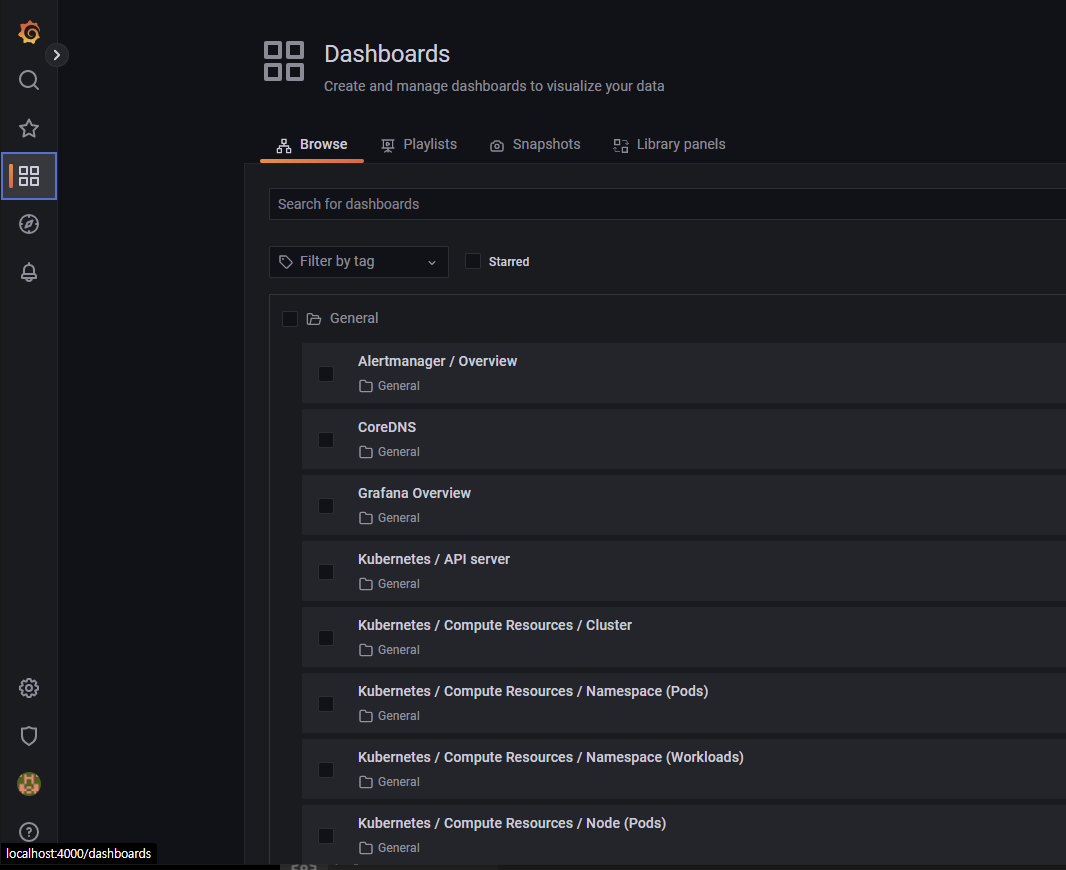
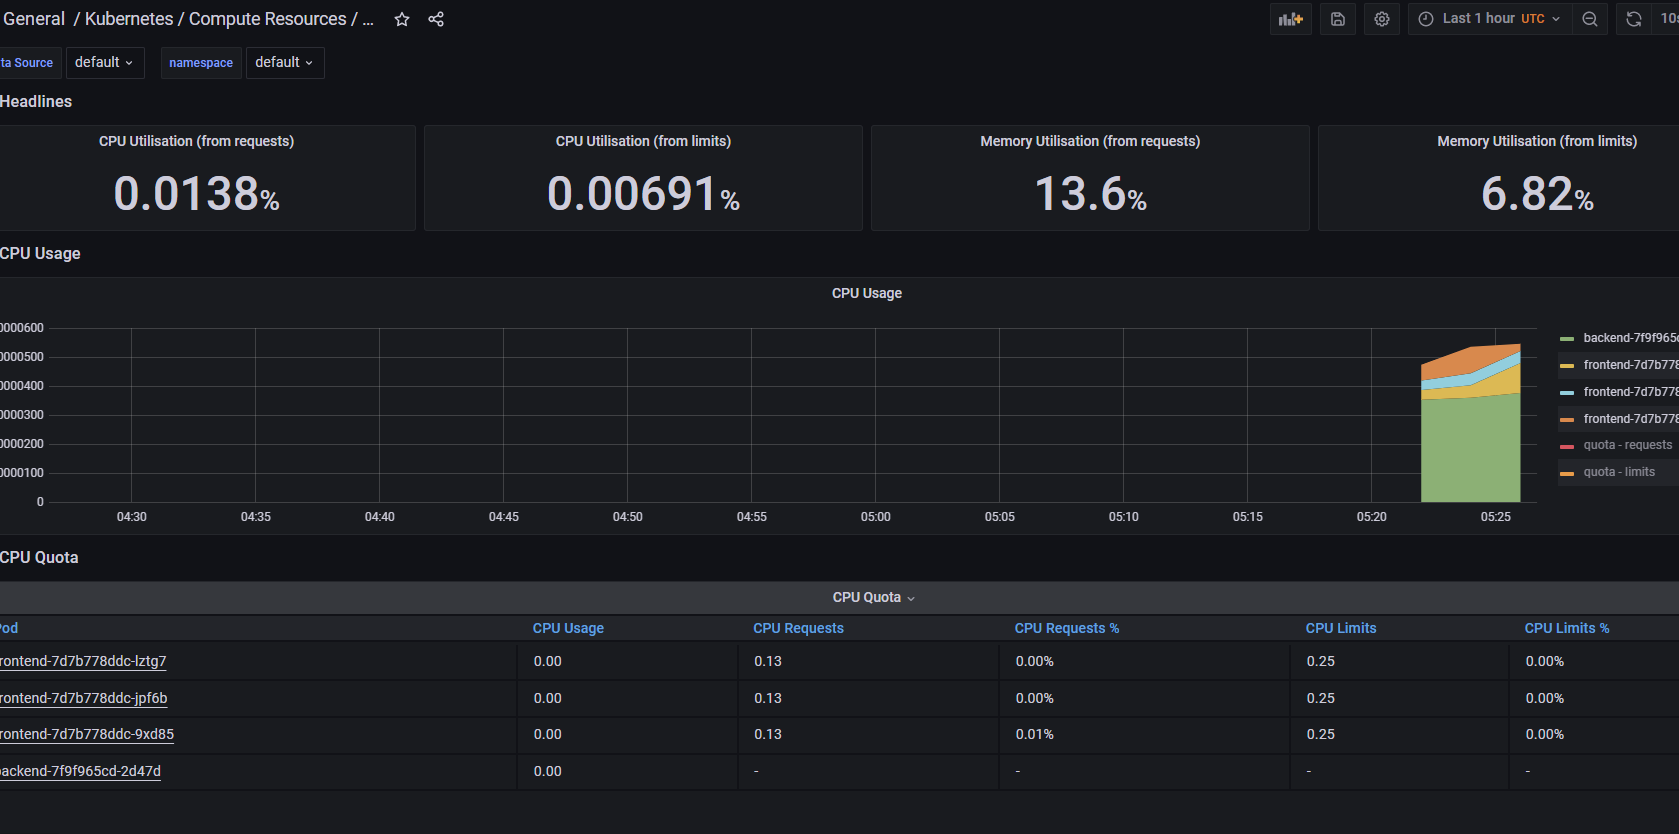
localhost로 접근하여 아이디 비밀번호를 입력후 dashboards로 가게될 경우 아래와 같은 모습을 볼 수 있습니다.
Namespace(Pods)를 확인하게 될경우 pod들의 메트릭 값을 볼 수 있습니다.
부하를 걸어 확인해봅시다.
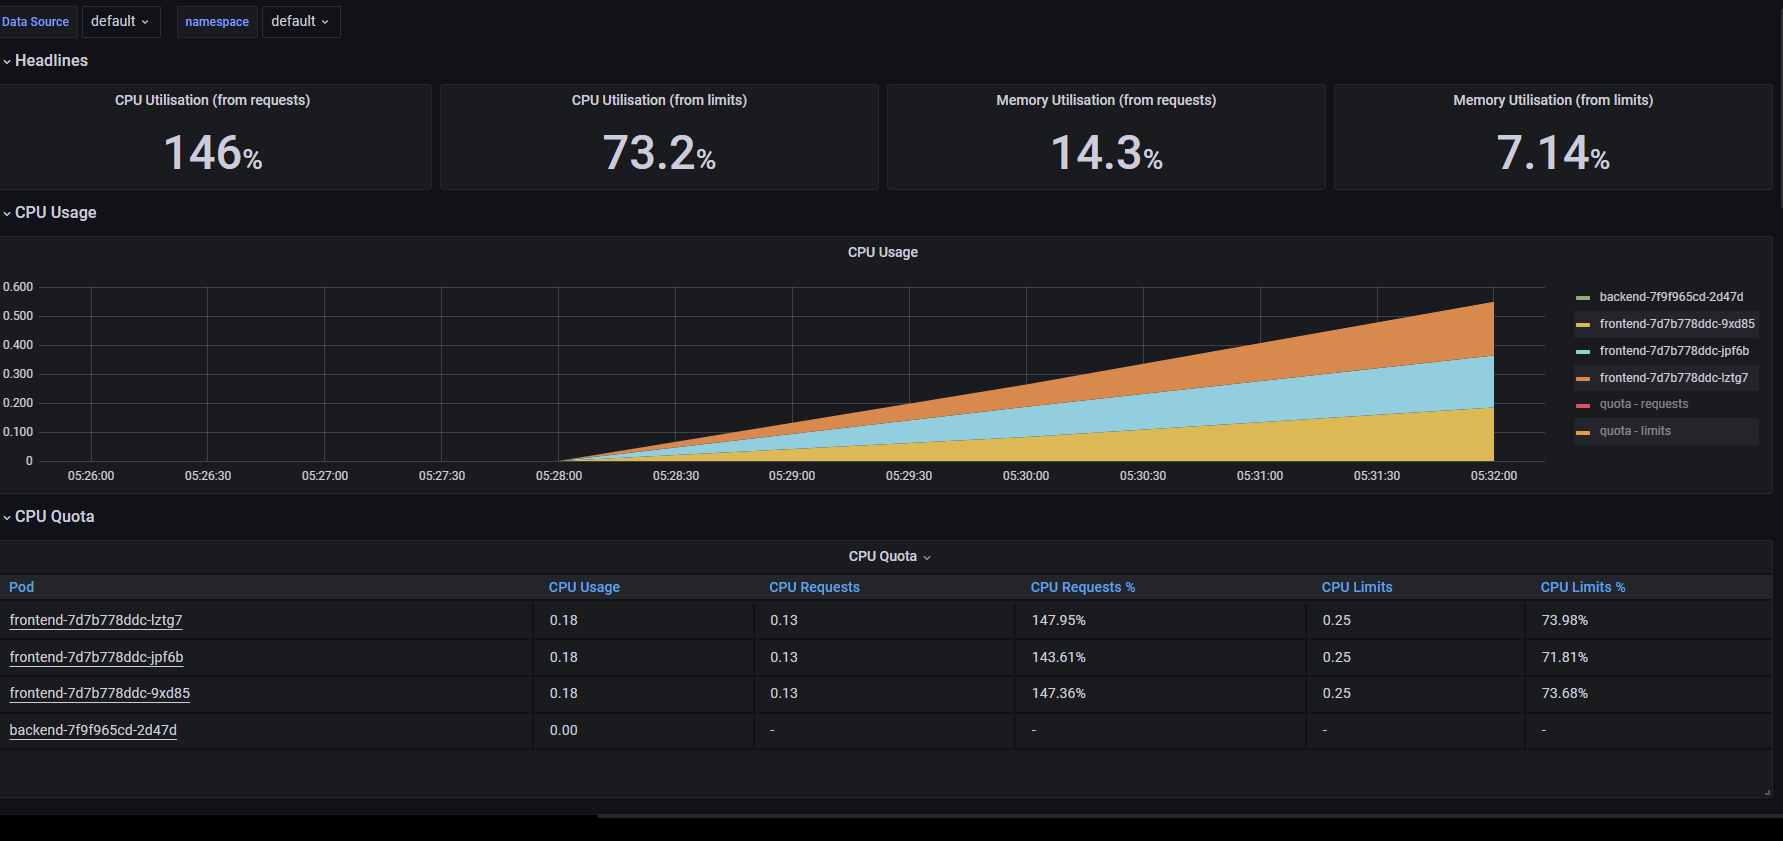
아주 잘 동작함을 볼 수 있었습니다.
정리
prometheus에 접속하는 방법도 동일하게 port-forwarding으로 진행이 가능하며 해당 prometheus에서 alert도 설정이 가능하게 되어 있습니다. 하지만 보기 쉽게 설정되어 있는 것이 grafana이다 보니 grafana로 대부분을 확인을 하였습니다. 또한 prometheus는 더 공부가 필요한 부분이 있기 때문에 더 공부 후에 따로 추가하도록 하겠습니다.