VISLab 과제로 지도 위에 원하는 좌표 시각화를 해보았다.
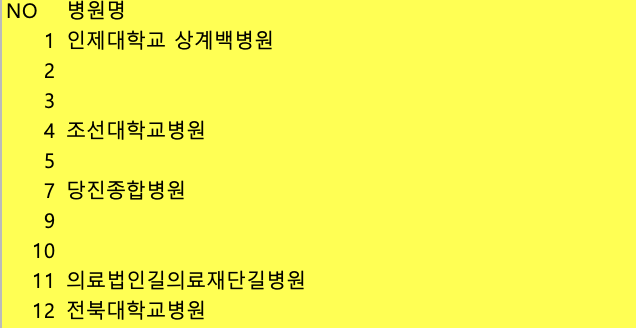
받은 데이터는 아래와 같은 병원 리스트였다. (.xlsx 파일)
먼저 결과화면은 아래와 같다.
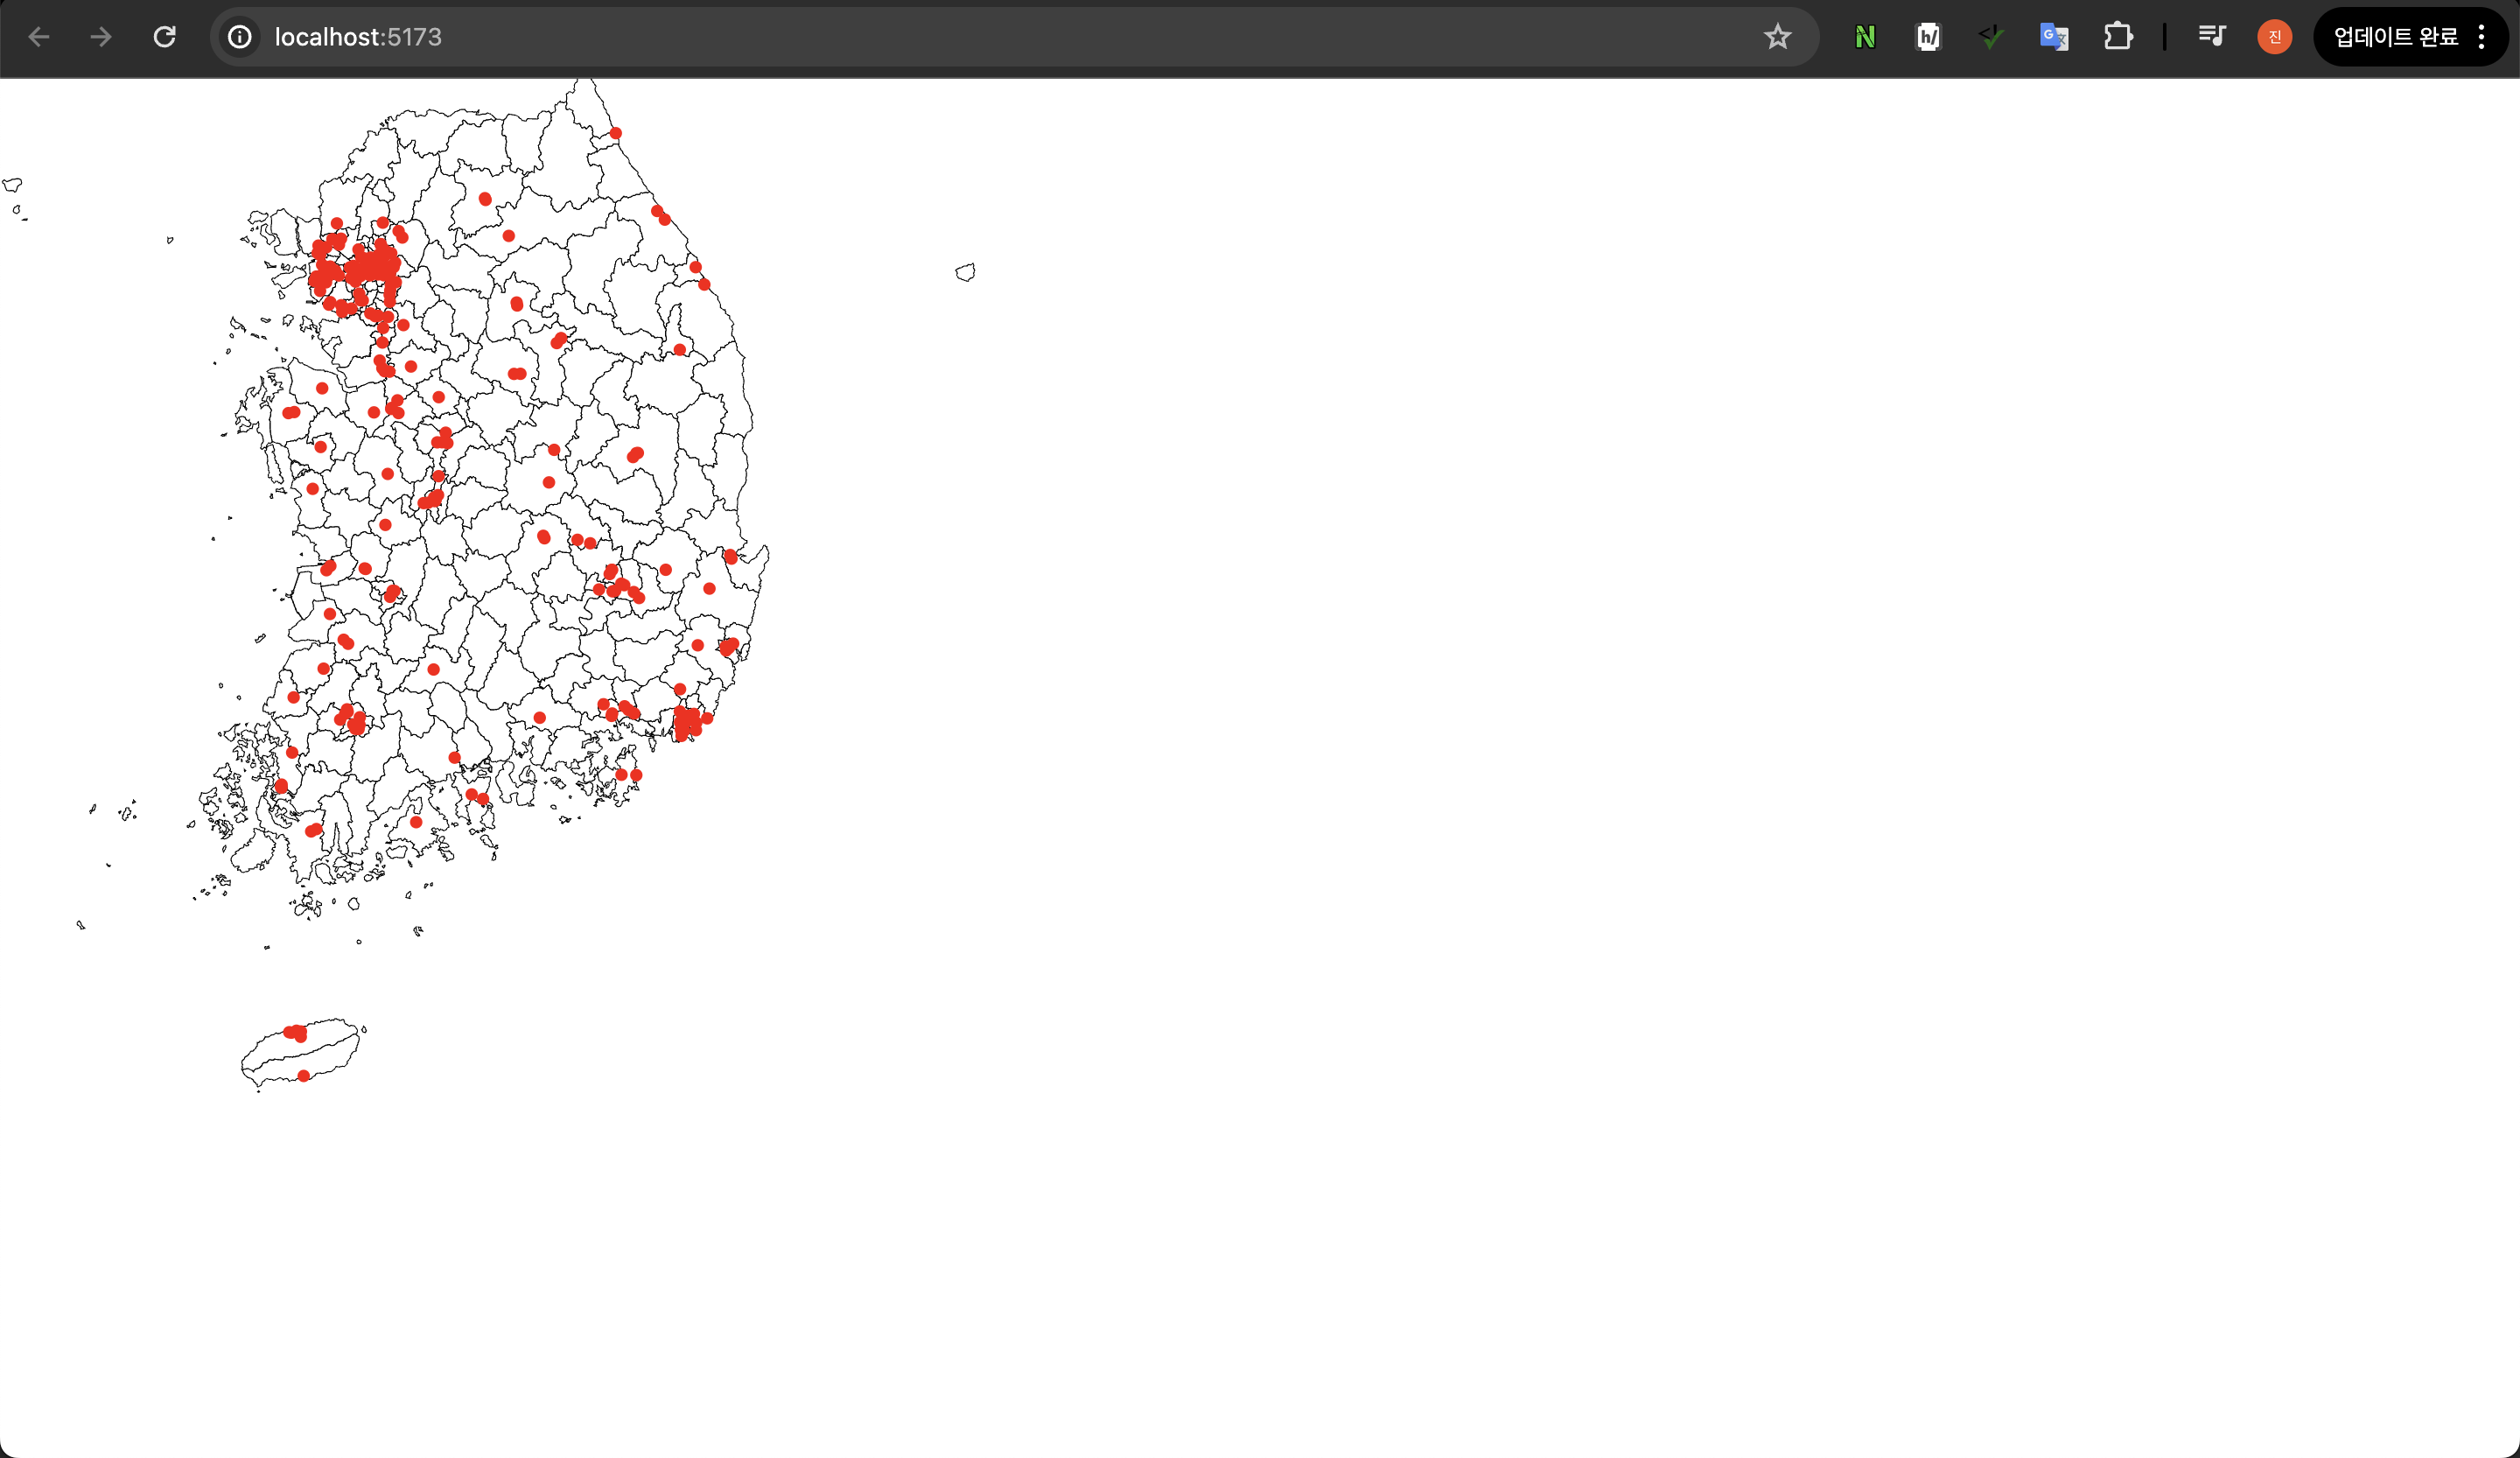
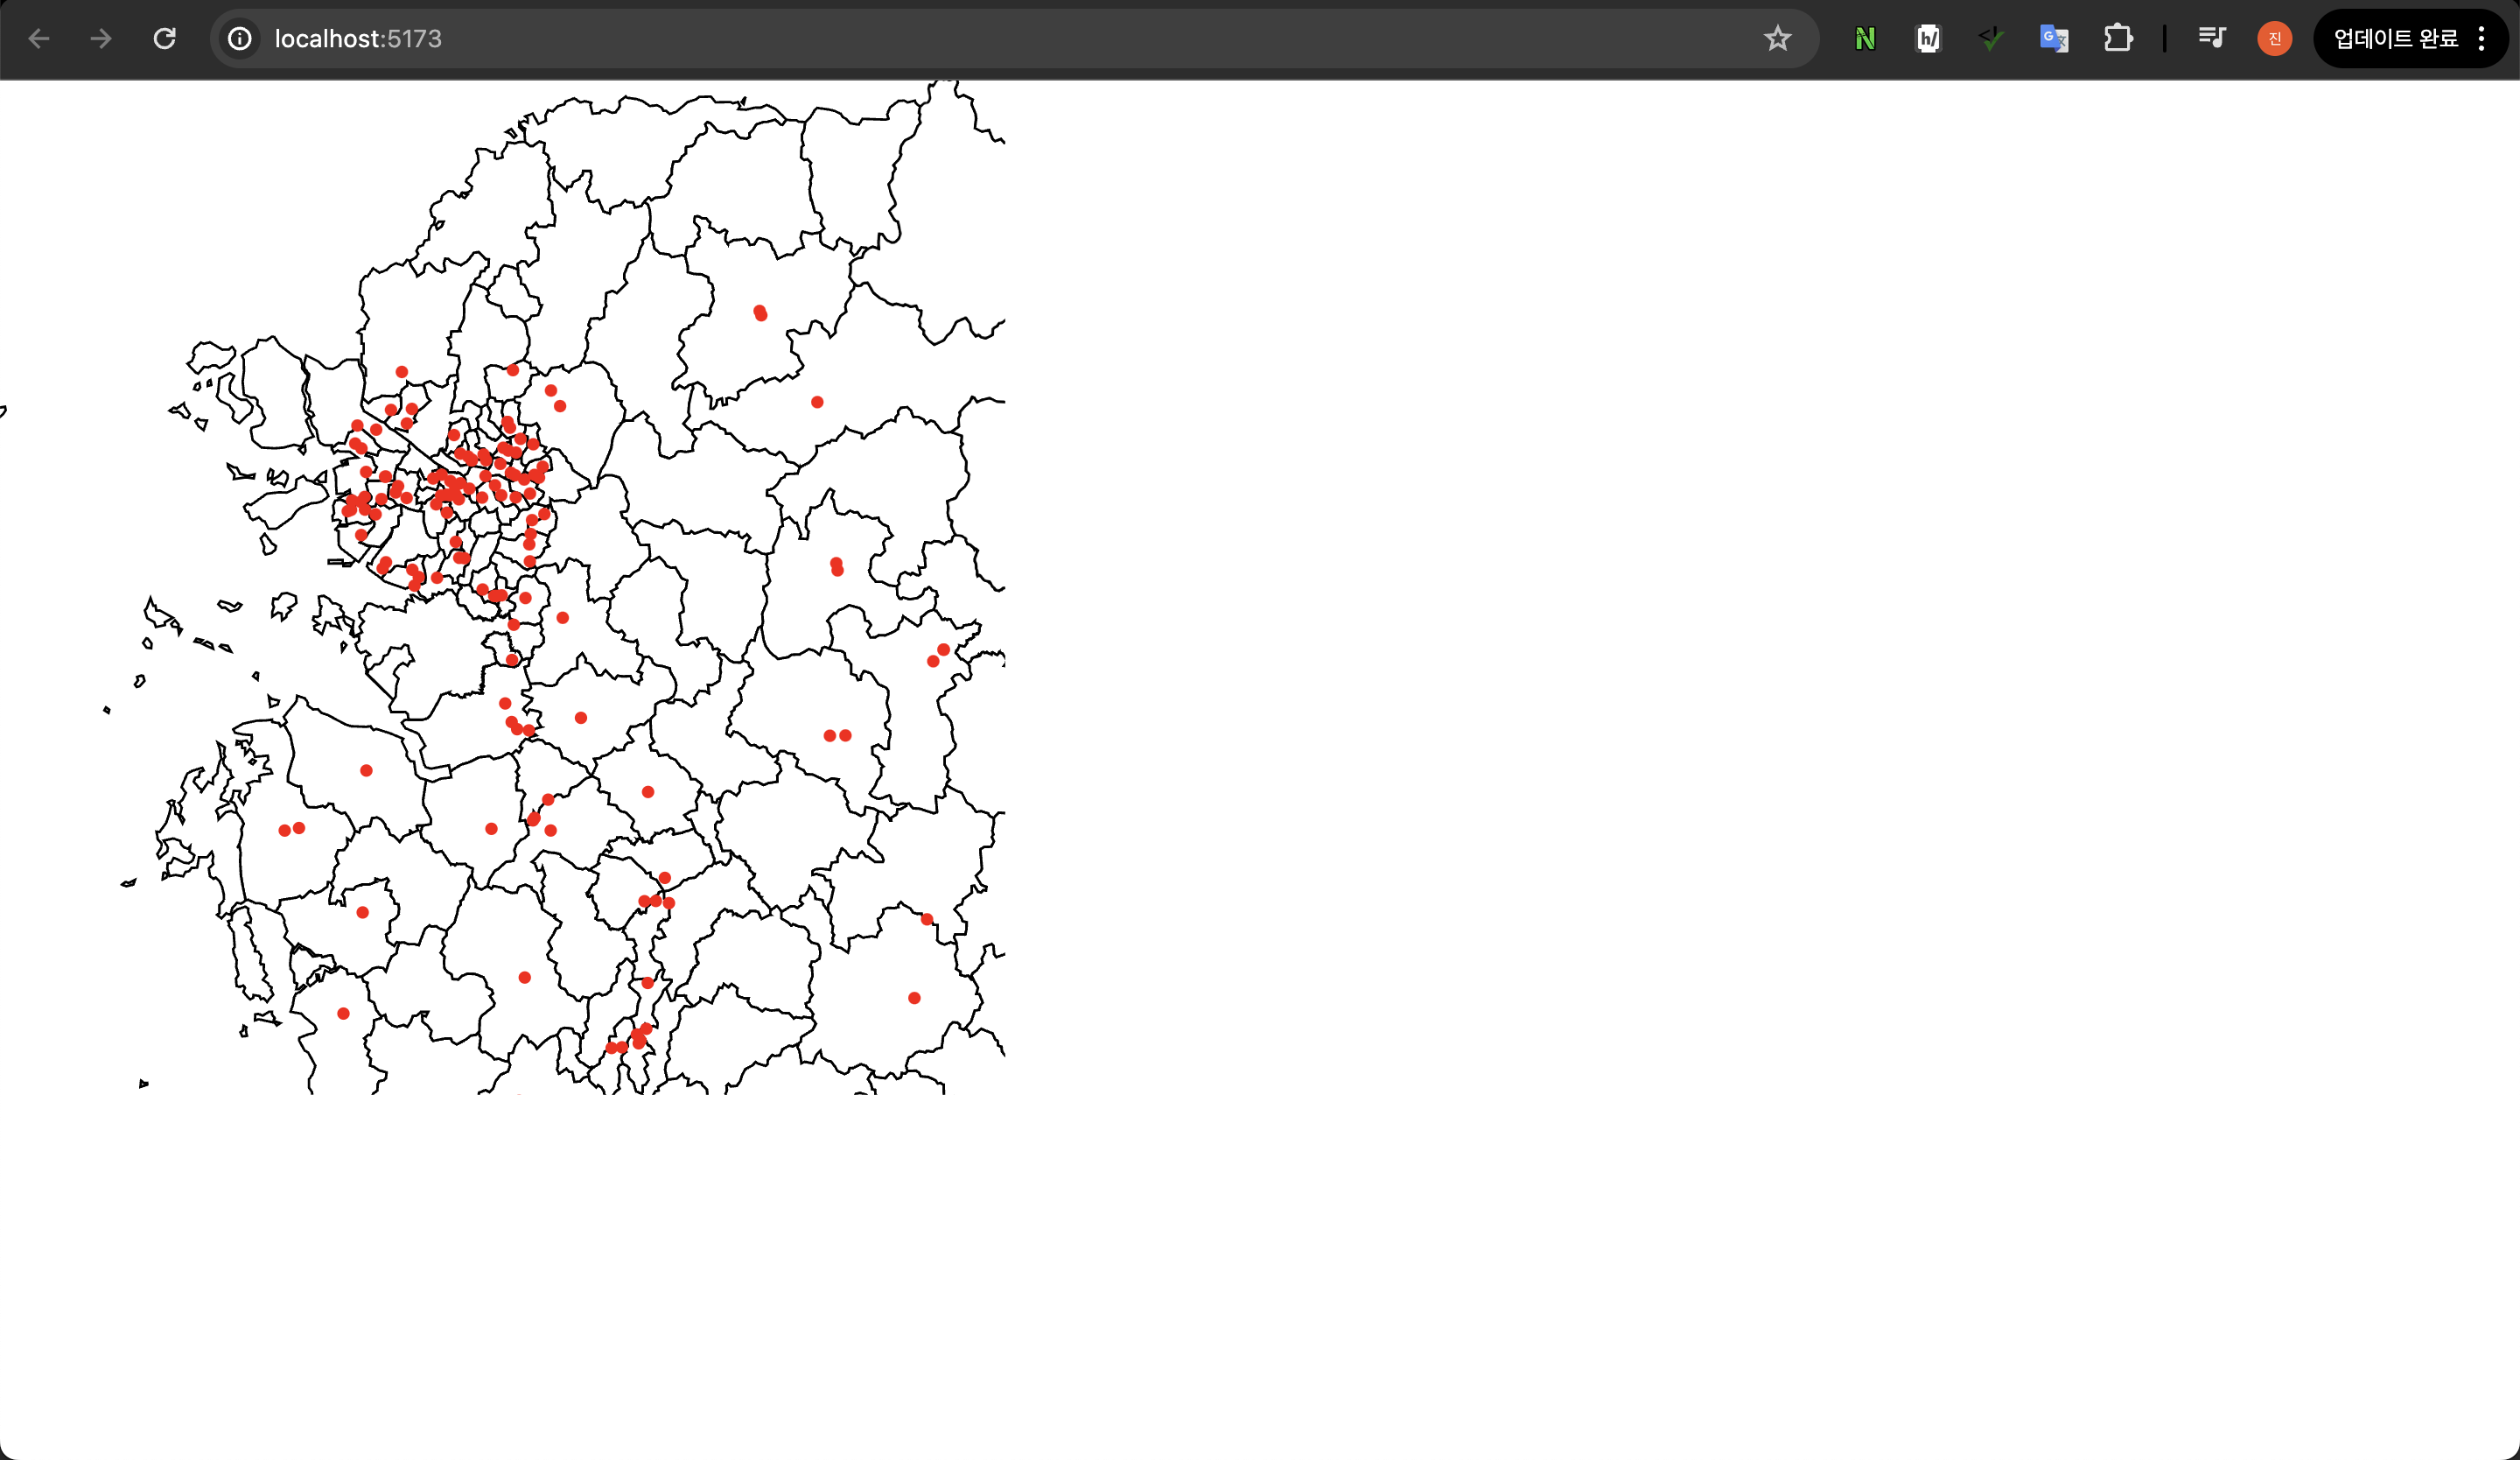
아래와 같이 줌도 되는 ~
줌 되면서 위치 좌표 dot의 크기도 같이 줄어들게끔 개발을 해봅시당
과정을 크게 아래와 같다.
- kakao API를 활용해서 병원명으로 coordinate 찾기
- d3 활용해서 지도 그리기
Kakao API로 coordinate 추출
- 데이터 읽기
import pandas as pd df = pd.read_excel('./POST_EVT_2_HOSP_NM.xlsx', engine="openpyxl") - 불필요한 데이터 전처리 및 필요한 칼럼 생성
HOS_NM_LIST = pd.DataFrame(df['병원명'].dropna()) HOS_NM_LIST["경도"] = 0 HOS_NM_LIST["위도"] = 0 - REST API 키 가져오기
-
아래 링크에서 로그인 > 내 애플리케이션 > REST API 키 복사
-
key.env파일 생성 : gitHub에 같이 커밋되면 안 되니까!//key.env 파일 REST_API_KEY = '복사한 거 붙여넣기' -
env 파일에서 KEY값 가져오기
import requests
from dotenv import load_dotenv
import os

env_path = './key.env'
load_dotenv(dotenv_path=env_path)
REST_API_KEY = os.getenv('REST_API_KEY')
-
- API 요청하기
-
받은 데이터 양식이 키워드라 키워드 API 사용함
-
주소 양식이면 다른 API 사용
-
아래 문서에서 테스트해볼 수 있다!
def hos_to_xy(addr):
    url = 'https://dapi.kakao.com/v2/local/search/keyword.json?query={}'.format(addr)
    headers = {"Authorization": "KakaoAK " + REST_API_KEY}

    response = requests.get(url, headers=headers)

    if response.status_code == 200:
        result = response.json()
        if result['documents']:
            match_first = result['documents'][0]
            return float(match_first['x']), float(match_first['y'])

    return 0, 0
-
- 경도(x), 위도(y) 값 입력하기
for idx in HOS_NM_LIST.index: xy = hos_to_xy(HOS_NM_LIST['병원명'][idx]) HOS_NM_LIST['경도'][idx] = xy[0] HOS_NM_LIST['위도'][idx] = xy[1] - json 파일로 추출하기
HOS_NM_LIST.to_json('HOS_TO_XY.json', orient='records', force_ascii=False)//HOS_TO_XY.json 결과 파일 [ { "병원명": "인제대학교 상계백병원", "경도": 127.0631048528, "위도": 37.6485740655 }, { "병원명": "조선대학교병원", "경도": 126.9265298275, "위도": 35.1389579045 }, { "병원명": "당진종합병원", "경도": 126.6843579756, "위도": 36.9043990238 }, ... ]
d3 활용해서 지도 그리기
React 사용했어요
코드 설명하기 귀찮다.
대충 몬말알?
import * as d3 from "d3"
import { useEffect, useRef, useState } from "react"
import * as MEDIUM from "../../assets/updated_SIG.json"
import HOS_LIST from "../../../../HOS_TO_XY.json"

export function GeoMap() {
    const containerRef = useRef<HTMLDivElement>(null);
    const rootSvg = useRef<SVGSVGElement>();
    const mapRef = useRef<SVGGElement>(null);
    const projectionRef = useRef<d3.GeoProjection>();
    const [mapSize, setMapSize] = useState({ width: 0, height: 0 });
    const [isInitialized, setIsInitialized] = useState(false);

    useEffect(() => {
        if (!containerRef.current || isInitialized) return;

        const svgWidth = 500;//containerRef.current.clientWidth;
        const svgHeight = 500;//containerRef.current.clientHeight;
        setMapSize({ width: svgWidth, height: svgHeight });

        const projection = d3.geoMercator().fitSize([svgWidth, svgHeight], MEDIUM);
        projectionRef.current = projection;

        d3.select(rootSvg.current)
            .attr("viewBox", `0 0 ${svgWidth} ${svgHeight}`)
            .attr("width", svgWidth)
            .attr("height", svgHeight);

        const svg = d3.select(mapRef.current);
        svg.attr("viewBox", `0 0 ${svgWidth} ${svgHeight}`)
            .attr("width", svgWidth)
            .attr("height", svgHeight);

        const path = d3.geoPath().projection(projection);
        const g = svg.append("g");

        g.selectAll("path")
            .data(MEDIUM.features)
            .join("path")
            .attr("d", path)
            .attr("fill", "white")
            .attr("stroke", "black")
            .attr("stroke-width", 0.5);

        const hospitals = g.selectAll("circle")
            .data(HOS_LIST)
            .join("circle")
            .attr("cx", d => projection([d.경도, d.위도])[0])
            .attr("cy", d => projection([d.경도, d.위도])[1])
            .attr("r", 3)
            .attr("fill", "red")

        const zoom = d3.zoom()
            .scaleExtent([1, 8])
            .on("zoom", (event) => {
                g.attr("transform", event.transform);
                hospitals.attr("r", 3 / event.transform.k);
            });

        svg.call(zoom);

        setIsInitialized(true);
    }, [containerRef.current]); // Ensure this runs only once after the component mounts

    return (
        <div ref={containerRef} className="w-full h-full">
            <svg ref={rootSvg}>
                <g ref={mapRef}></g>
            </svg>
        </div>
    );
}
숭실대학교 컴퓨터학부 21