Receiver Operation Curve (ROC) and Area Under Curve (AUC) are important evaluation metrics used in evaluating the performance of the binary classification model.
ROC describes the change in True Positive Rate (TPR) according the change of False Positive Rate (FPR).
True Positive Rate is rate of the true positive classifications out of entire true label-values. In other words TPR is identical to recall-score we have studied in the previous post (TP / (TP + FN)) .
Converse to TPR, there is a True Negative Rate (TNR) also known as Specificity which is equal to (TN / (TN + FP)) .
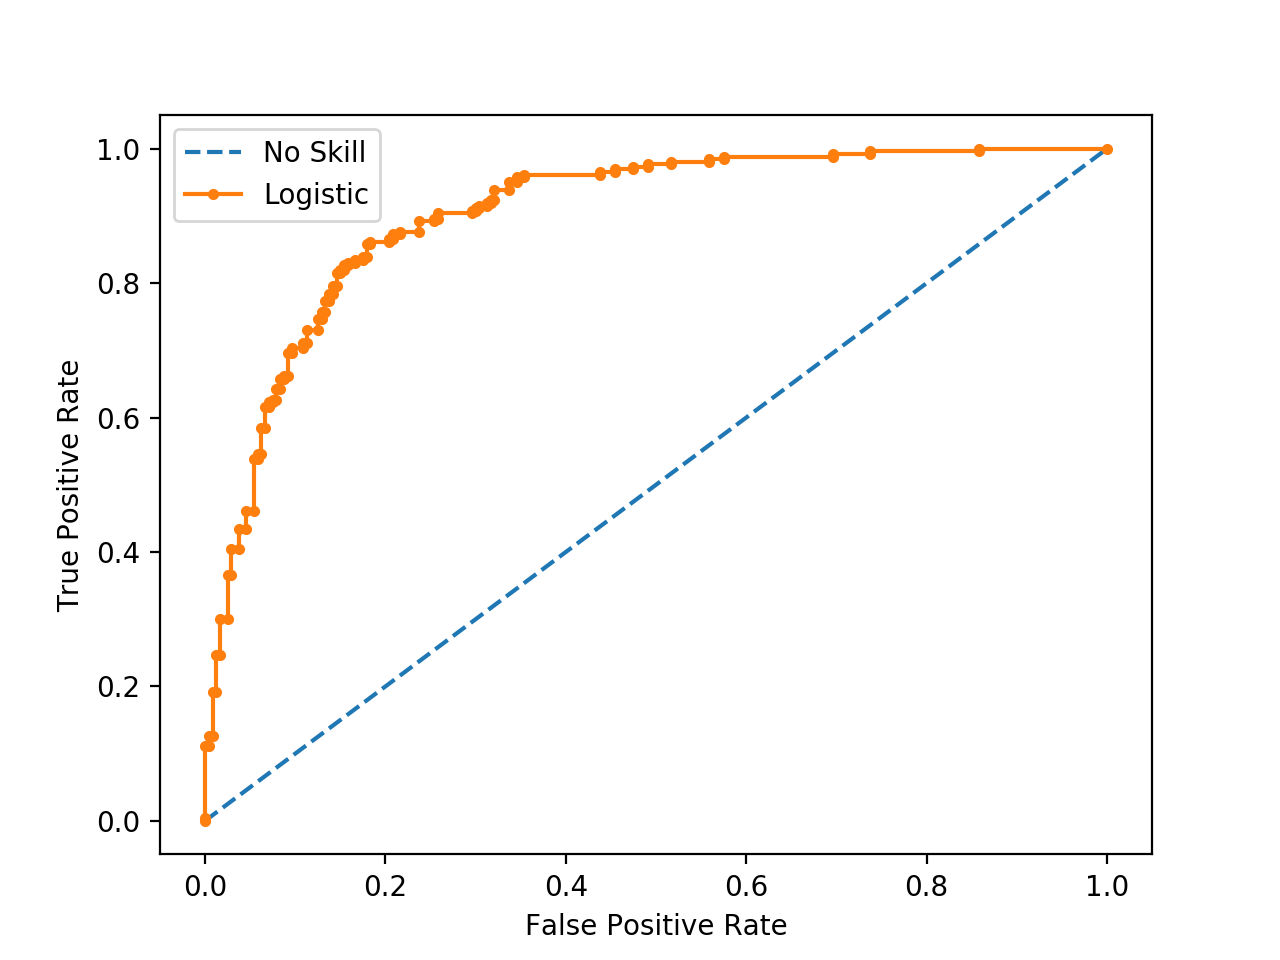
Above is the example of ROC. Straight dotted line which connects the curve is the minimum value of ROC. ROC is better as the summit is farther away from the straight line.
ROC returns the TPR by adjusting the FPR in the range of 0 to 1. Using the threshold-adjustment we discussed previously, we will be adjusting the FPR to see the change in TPR.
Using Scikit-learn's roc_curve() API we will visualize the ROC for Titanic dataset.
Input
# use roc_curve() API
from sklearn.metrics import roc_curve

pred_proba_class1 = lr_clf.predict_proba(X_test)[:,1]

fprs, tprs, thresholds = roc_curve(y_test, pred_proba_class1)
thr_index = np.arange(1, thresholds.shape[0], 5)

print('Threshold Value Index : ', thr_index)
print('Values of Thresholds : ', np.round(thresholds[thr_index],2))

# FPR & TPR Rate Value
print('FPRS : ', np.round(fprs[thr_index], 2))
print('TPRS : ', np.round(tprs[thr_index], 2))
Output
Threshold Value Index :  [ 1  6 11 16 21 26 31 36 41 46]
Values of Thresholds :  [0.94 0.73 0.62 0.52 0.44 0.28 0.15 0.14 0.13 0.12]
FPRS :  [0.   0.01 0.03 0.08 0.13 0.25 0.58 0.61 0.75 0.85]
TPRS :  [0.02 0.49 0.7  0.74 0.8  0.89 0.9  0.95 0.97 1.  ]
Input
def roc_curve_plot(y_test, pred_proba_c1):
    fprs, tprs, thresholds = roc_curve(y_test, pred_proba_c1)

    plt.plot(fprs, tprs, label='ROC')
    plt.plot([0,1], [0,1], 'k--', label='Random')

    start, end = plt.xlim()
    plt.xticks(np.round(np.arange(start, end, 0.1),2))
    plt.xlim(0,1); plt.ylim(0,1)
    plt.xlabel('FPR (1 - Sensitivity)'); plt.ylabel('TPR (Recall)')
    plt.legend(); plt.grid()

roc_curve_plot(y_test, pred_proba[:,1])
Output
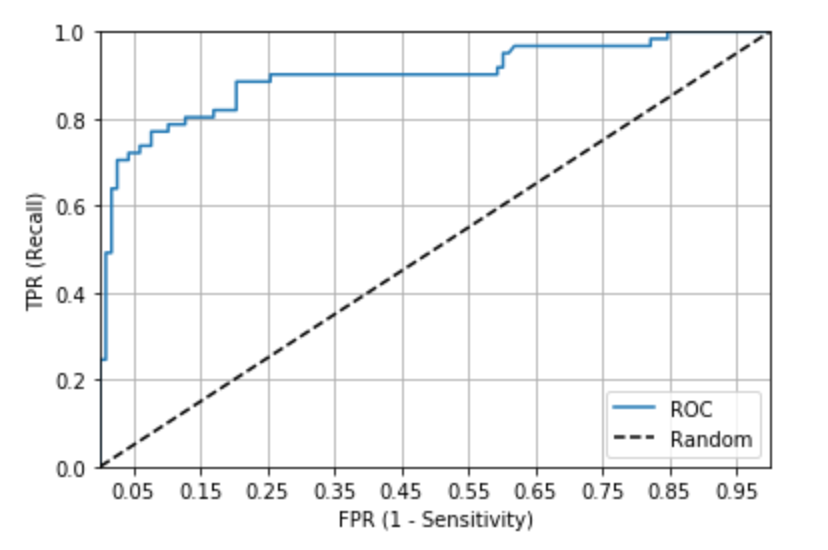
We see that the summit of the curve is fairly distanced from the straight-line. Now we will estimate the AUC.
Input
pred_proba = lr_clf.predict_proba(X_test)[:, 1]
roc_score = roc_auc_score(y_test, pred_proba)
print('ROC AUC Value : {0:.4f}'.format(roc_score))
Output
ROC AUC Value : 0.8987