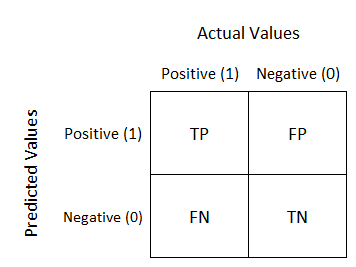
Confusion Matrix which is often used as an evaluation metrics in binary classification shows how much the model is confused while performing the prediction. In other words, confusion matrix describes the performance of classification model on a set of test data for which the true values are known.
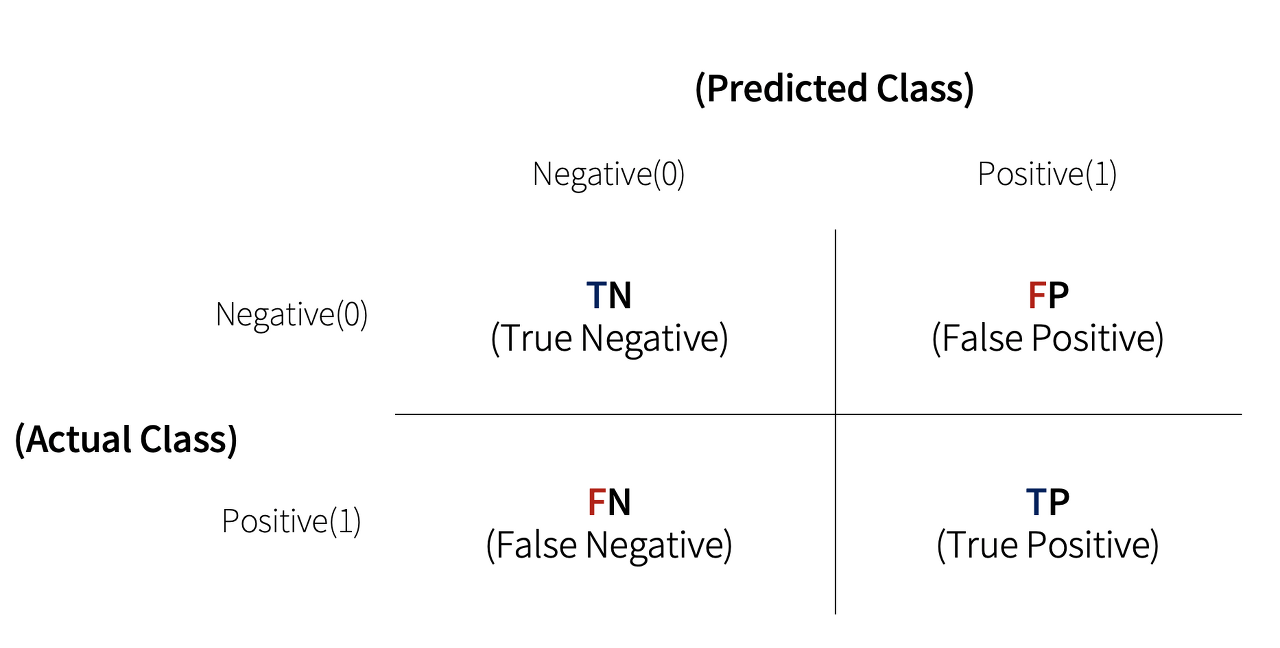
- TN : Predicted Negative(0), Actually Negative(0)
- FP : Predicted Positive(1), Actually Negative(0)
- FN : Predicted Negative(0), Actually Positive(1)
- TP : Predicted Positive(1), Actually Positive(1)
Scikit-learn provides confusion_matrix() API to visualize confusion matrix. Using the MyFakeClassifier from the previous post, we will pass pred and y_test as parameters of confusion_matrix().
Input
# confusion matrix
from sklearn.metrics import confusion_matrix

confusion_matrix(y_test, pred)
Output
array([[405,   0],
       [ 45,   0]])
The confusion matrix does not have any TP or FP-values since the model simply predicted every values to be False(0).
Confusion matrix also provides multiple base-information to deduce various evaluation metrics such as accuracy, precision, and recall.
As we have studied previosuly, accuracy is determined by how much the model has correctly classified the feature data (TP + TN). Therefore, using the confusion matrix we can re-define the equation of accuracy as
Accuracy = (TP + TN) / (TP + TN + FP + FN)

Recently, I used an H-E-B gift card on www.heb.com/survey I received as a thank-you gesture, and it was such a delightful experience. The variety of options, from groceries to household items, allowed me to pick up some treats and essentials without worrying about the budget. It's a great way to show appreciation and make someone's day a little brighter.