[Paper Review] Deep learning-based survival prediction for multiple cancer types using histopathology images
Paper Review
Deep learning-based survival prediction for multiple cancer types using histopathology images
Google health에서 진행한 연구로 patch selection, alternative loss function, aggregation, pan-cancer과 관련된 내용을 담고 있는 논문이다.
Materials and methods
Data
TCGA dataset
FFPE slide, frozen sample specimen 모두 포함되었음.
Case-level annotation이 모든 whole slide image에 동일하게 annotated.
여러 organ (study) 중 event 가 충분히 일어난 dataset 만 활용함
ex) THCA event 일어난 환자 수 부족해서 제외. OV pathologic T stage 자료 없었으나 event 일어난 환자 데이터 많아서 clinical T stage 자료 많아서 포함시킴.
4880 cases (12095 images) - train / validation, 1216 cases (3009 images) - evaluation

Deep Learning System (DLS)
Whole slide image로부터 morphological feature를 뽑아내기 위함.
Patch 들에 대해 deep neural network 통과시키고 average pooling을 통해 확률값 return.
Neural Network Architecture
MobileNet과 비슷하게, depth-wise separable convolution layers로 구성됨. (few parameters)
Case 당 여러 WSI 가 존재하는데, WSIs 중 tissue containing region에서 256 x 256 pixel patch.
Random sampling 의 정당성을 확률로 묘사함. + generalize to multiple slides per case.
ex) WSI 안에 informative patch의 빈도를 p라 표현했을 때, informative patch가 없을 확률은 (1-p)^n 이므로 shrinking towards zero.
Survival Loss Function
- Extended Cox partial likelihood
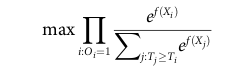
: 일반 cox loss랑 비슷함. beta X 대신 f(X)가 들어간 것이 차이점. DeepSurv랑 비슷. (non linear function도 학습 가능하다.)
추가로, tied event times에 대해서는 Breslow’ approximation을 사용함.
- Exponential lower bound on the concordance index
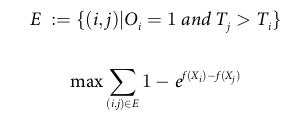
: concordance index는 그 자체로 미분 불가능하지만, indicator function의 미분 가능한 lower bound 함수를 통해 loss를 설정하고 이를 gradient descent에서 활용함. 위에 첨부된 식이 Indicator(f(xi)-f(xj)) 를 대체하는 lower bound 식임.
- Censored cross-entropy

:discretizing time into interval → survival prediction as a classification problem
오른쪽 censored 데이터에 대해서는, 가장 가까운 interval에 속하도록 labeling 후 cross entropy loss.
Cancer type마다 다른 quantile 사용함. (어쩌면 당연) 4개의 bin으로 나뉘도록 설정함.
성능이 가장 잘 나옴. ← 채택됨.
Training / Evaluation
16 patches per case, 1024 patches per case.. ? 이 부분 이해가 잘 안갔음.
RMSprop optimization
Survival Analysis
107 days vs 108 days 등의 무의미한 비교를 피하기 위해, survival times were discretized from days to months for all analyses. 이후 c-index 측정할 때 같은 그룹에서 나오지 않도록 하는 것인가?
DLS 기반 risk score로 cancer type마다 risk group을 나눴음.
First Analysis: 어느 variable이 correlate 되었는가를 보기 위함
Pathologic stage는 numerical 수치로 (1, 2, 3, 4), age도 10으로 나눈 numerical 수치로 사용.
(그 이유가 insufficient data for using dummy variable이라 하는데 이해 안감..)
Dummy variable을 사용할 때 data가 많아야 하나?
CoxPH model을 사용함. Cancer type (study)마다 model을 적용하였고, combined model에서는 cancer type에 대한 column을 추가해서 학습함.
Second Analysis: DLS + clinical data (baseline)
COX PH model 과 leave-one out cross validation (LOO) -
to control for the natural improvements in model fit with more input variables
Combined study 에서는 (concordant-pairs A+ concordant-pairs B ) / (informative-pairs A + informative-pairs B) 이런 느낌으로 c-index 나옴.
Results and discussion

DLS에 의해 나눈 risk group을 KM estimation 돌린 결과. (잘 나뉨.)
이후 stage 별로 high/intermediate/low 도 했으나 잘 안 나뉘었음.
First Analysis:
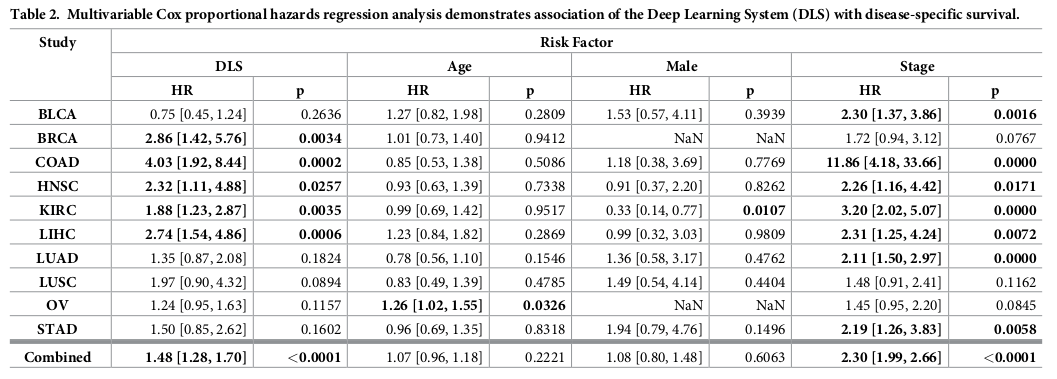
DLS 기반 risk score가 survival prediction에 significant predictor임을 hazard ratio와 p값으로 확인.
각 study, combined 뿐만 아니라, FFPE only, grade, histologic subtype에서도 significant함을 확인.
Second Analysis:
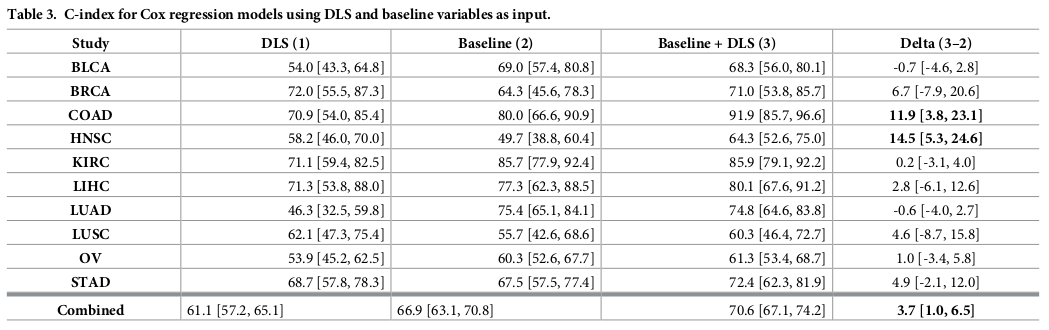
Baseline + DLS 했을 때 c-index가 가장 잘 나왔음.
Individual study만 했을 때는 confidence interval 이 too wide to draw meaningful conclusion.
10 studies combined study로 진행함.
Understanding the DLS: Explainability Heatmap
Regions of each slide that contributed to the overall case classification by extracting the individual patches with the highest and lowest patch-level DLS risk scores.
“Most confident” predictions for high or low risk 값들을 띄는 patch → contain tumor하는 경향
그저 그런 prediction value를 띄는 patch → non tumor tissue 가리키는 경향.
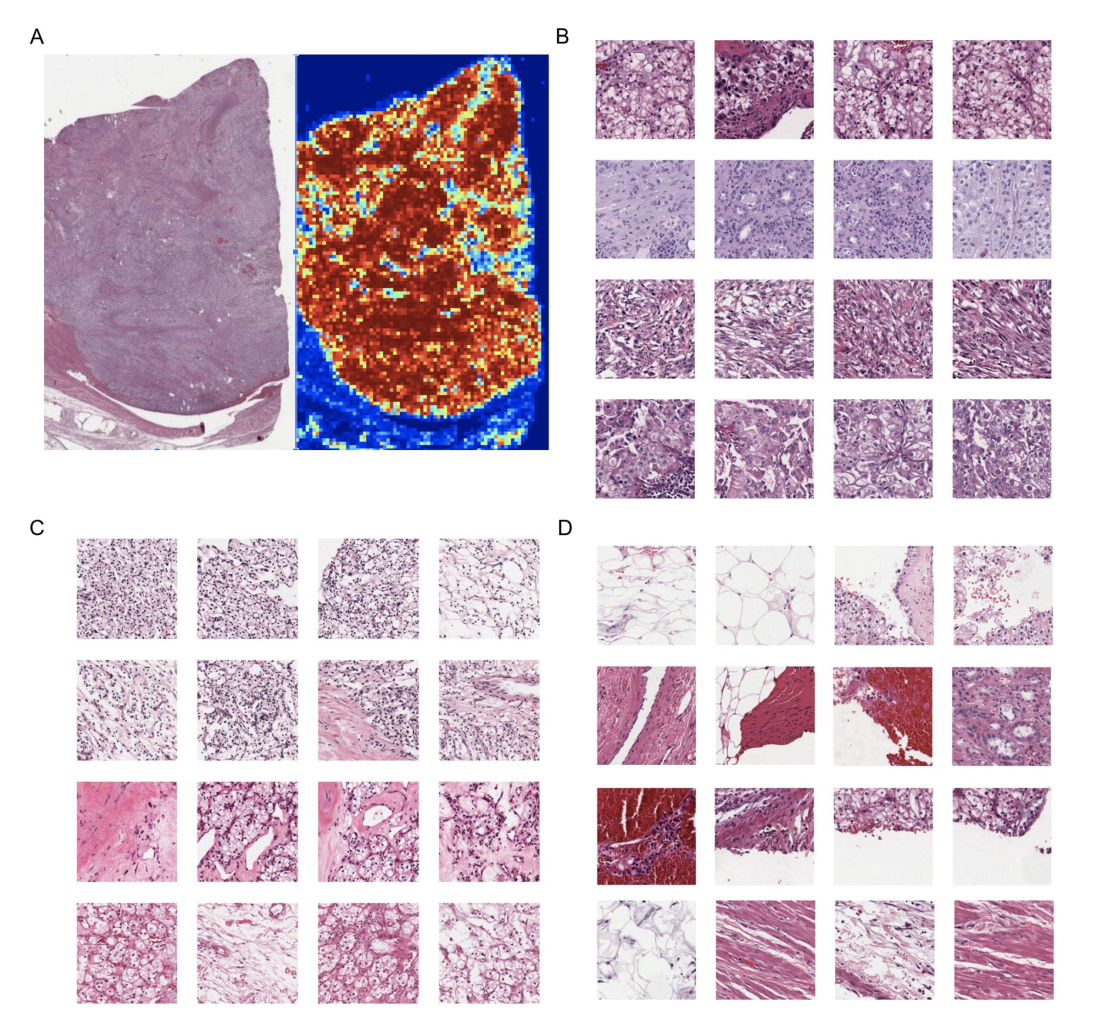
Kidney (KIRC)에 대해서 적용됨.
Tradeoffs of weak supervision:
While we did not identify any clear trends or confounders specific to the cancer types for which the models performed best, future work to better understand the effects of sample size, image-specific variables, and disease-specific variables on clinical predictions from WSIs will be important for the field.
Evaluation of learned features:
While other machine learning efforts have identified prognostic significance for non-tumor elements, our observations suggest that at least for our specific models, the morphologic features of the tumor appear to be more relevant than non-tumor regions.
DLS-learned features may correspond to previously unappreciated representations of tumor biology in histology, and that underlying biological pathways or molecular mechanisms may be further elucidated via focused evaluation of regions highlighted by the DLS.
Conclusion
- selecting image pathces: 환자별로 존재하는 여러 WSI 상에서 random 하게 patch를 뽑아 사용하였다.
- alternative survival losses: partial likelihood 이외에 concordance index function의 exponential lower bound와 discretized time interval 을 이용한 cross entropy loss 를 사용하여 gradient based method로 학습을 진행하였다.
- patch feature aggregation: patch의 feature를 average pooling을 통해 합하였다.
- pan-cancer modeling: survival model을 통해 10가지의 cancer type 이미지를 학습하였다.
전반적으로 진행중인 연구와 유사점이 많고 참고할 만한 부분이 여럿 있는 논문이었다. 획기적인 방법이 있던 논문은 아니지만 이전에 있던 방법들을 잘 조합해서 여러 데이터들에게 적용해 보고, 그 데이터 들을 잘 정리한 느낌의 논문이었다.
이번 리뷰에서는 전보다 간략하게 설명하였다. 앞으로도 이런 형식으로 리뷰가 이루어질 것 같다!