[Paper Review] Image analysis with deep learning to predict breast cancer grade, ER status, histologic subtype, and intrinsic subtype
Paper Review
Image analysis with deep learning to predict breast cancer grade, ER status, histologic subtype, and intrinsic subtype
배정받은 첫 논문이다. 한 review article의 레퍼런스에 포함된 논문들 중 업무와 직/간접적으로 연결된 5개의 논문을 받았다. Couture2018a 논문은 tile selection과 tile aggregation과 관련된 내용을 담고있다.
발표 후 추가 사항 정리
- 전체 파이프라인과 라벨에 관한 내용
- patient-level label을 각 TMA spot에도 동일하게 적용한다.
- TMA spot은 보통 2500 x 2500 px 의 크기이고, image region은 그 내부에서 800 x 800 px 랜덤하게 여러번 뽑혔다.
(glass 등의 background가 50% 넘지 않도록 crop) - 하나의 image region이 SVM ensemble에 의해 각 class에 속할 probability를 assign 받는다.
- 한 patient에 속하는 모든 core의 모든 image region에 대한 확률들이 quantile function으로 aggregate 된다.
- 이 quantile function의 값 (quantile boundary value)이 두번째 patient-level classification에 사용된다.
(linear SVM with sigmoid calibration)
- ROR-PT score과 관련된 내용
- patient-level 로 label 되었으며, 구체적으로 gene expression을 기반으로 해서 환자마다 매겨진다.
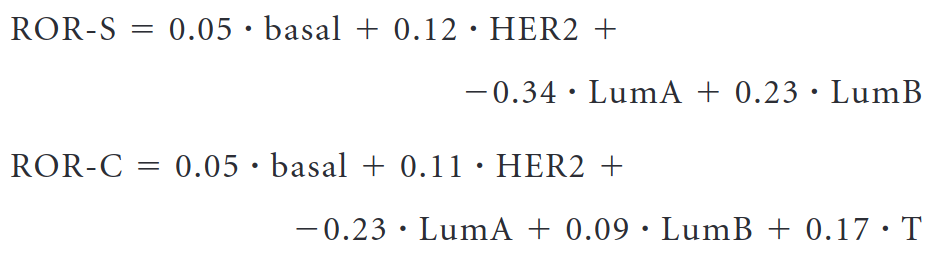
- 아래 추가했던 ROR score 계산식은, 다른 ER status 등의 property를 통해 ROR score를 이런식으로 추정할 수 있다라는 학습 모델을 보여준 것. 본 논문의 내용과는 관련 없음.
- Quantile function과 관련된 내용
- 하나의 patient에 100개의 instance(image region)가 있다고 가정해보자. 각 instance는 클래스마다 특정 probability를 assign 받았을 것이고, 지금은 우선 두 개의 클래스 중 하나의 클래스에 대해서만 생각해 보자.
- 나는 하나의 patient에 속한 100개의 instance에 대해 5개의 quantiles를 가진 quantile function으로 표현할 것이다.
- 10개의 instance가 SVM ensemble model에 의해 0~0.1의 probability을 할당받았고, 20개의 instance가 0.1~0.4을 할당받았고, 20개의 instance가 0.4~0.5를 할당받았고, 20개의 instance가 0.5~0.8을 할당받았고, 20개의 instance가 0.8~0.9를 할당받았고, 나머지 10개의 instance가 0.9~1의 값을 할당 받았다고 하자.
- 이렇게 되면 다음 두번째 SVM classifier에 들어가는 한 클래스의 quantile은 0.1, 0.4, 0.5, 0.8, 0.9가 되는 것이다.
- 결국 quantile function을 "학습"한다기 보다는, 한 환자에 속한 각 instance들의 pool의 특성을 quantile function으로써 "표현"한다는 느낌이 더 어울린다.
Introduction
기존 질병 예측(prognostication)은 대부분 비용이 많이 들고 새로운 데이터에 적용이 어려운 molecular method를 사용해왔다. 또한 image analysis를 통해 small patch로부터 유의미한 특징을 추출해내는 시도는 small scale에만 초점이 잡혀있어 large scale로부터 복잡한 특징을 추출해내는 것이 어려웠다.
본 논문의 핵심적인 가정은 다음과 같다.
A deep learning method for image analysis could be applied to classify H&E stained breast tumor tissue microarray (TMA) images with respect to histologic and molecular features.
Tumor grade, histologic subtype, estrogen receptor (ER) status, intrinsic breast cancer subtype, Risk of Recurrence (ROR)-PT score과 같은 large scale이자 복잡한 특징을 추출하고자 하였다.
Method
Image analysis pre-processing and feature extraction
-
color and intensity normalization
: slide fading과 같은 실험 상 발생할 수 있는 noise를 제거하고자 함. -
VGG16 architecture pre-trained on ImageNet
: cell-by-cell morphology에 집중하면 새로운 data set에 적용하기가 어렵기에 tissue properties를 잡고자 함. -
Output from 4th convolution layer was extracted.
: generalizable, discriminative하 중간 layer를 추출함.
: convolutional한 특성 때문에 어느 image size라도 input으로 들어갈 수 있음.
: Output feature dim = 512.
ex) 2500x2500 -> 284x284x512 features -> 잘못씀. 800 x 800이 학습에 들어가서 284 x 284 x 512로 나옴.
Model training and training data sets
TMA image와 patient-level label을 training에 사용하였다.
input size가 크고 label이 weak하며 heterogeneity of image region이 관측되었기에 새로운 classifier 방식이 고안되었다.
Intra-tumoral heterogeneity를 설명하기 위해, 얼마나 각 image region이 각 class에 해당되는지를 계산하는 probabilistic model을 만들었고, 이 계산 값은 all image regions 전반으로 aggregation되어 전체 tumor prediction을 만든다.
1) Linear support vector machine (SVM) calibrated with isotonic regression
calibration은 예측된 probability가 실제 confidence를 반영하도록 만드는 task이다. 예로, 100개의 예측값이 있다고 하고 모델이 특정 class label 에 대한 예측 probability로 0.8을 반환했을 때, 80개 정도가 잘 분류되면 perfect calibration 이며, calibration task 는 이를 목표로 한다.
Isotonic regression은 piecewise-constant non-decreasing function을 학습함으로써, SVM에 의해 학습된, 각 vector와 hyperplane 사이의 "거리"를, 각 region이 특정 class에 속할 "probability"로 transform 해준다. Model fitting과 calibration 과정은 disjoint 해야 하므로 cross-validation을 통해 따로 나뉜 set에서 calibration이 따로 이루어졌다. 이후 각 region의 probability들은 quantile function으로 aggregate되고, 본 논문에서는 16 equally spaced quantiles로 학습하였다.
(5-fold 중 1개의 set은 calibration/validation 용으로 사용되었다. ensemble model에서의 prediction 값을 평균 내서 test set에 사용되었다.)
2) Second linear SVM classifier with sigmoid calibration
위에서 계산한 quantile 값들은 overall tumor prediction을 수행하는 second linear SVM classifier를 학습하는데에, class label로써 사용되었다. 논문의 표현을 빌리자면 다음과 같다.
The quantiles of the training images were used to train another linear SVM to predict the class label for the whole tumor, with sigmoid calibration transforming the SVM output into probabilities. This method allowed predictions to be made for individual image regions, while also aggregating to overall tumor predictions.
Prediction in test sets
- 800x800 pixel overlapping regions with a stride of 400 pixels가 사용됨.
- calibrated SVM ensemble은 binary class에 probability를 assign 함.
:몇몇은 multi-class 임에도 binary로 진행함.
Result & Discussion
전체 TMA core에서 2/3(n=571)를 training에, 1/3(n=288)을 test에 사용하였다.

Image analysis를 통해 probability of high-grade tumor를 계산하였다. 계산한 probability의 cut point >0.80을 설정하여 나머지는 버리고 accuracy(82%)와 kappa(0.64)값을 구하였다. 두 Pathologist의 성능인 accuracy(89%), kappa(0.78)과 비교했을 때 좋지 않았다.

마찬가지로 image analysis를 통해 molecular characteristic (ER status)를 예측하였고 accuracy(agreement) 및 kappa 값이 측정되었다. 결과가 직접 나와있지는 않지만 선행 연구 결과와 비교했을 때 두 pathologist 사이의 kappa 값(0.70)과 image analysis-pathologist kappa 값(0.64) 비교했을 때 살짝 낮았고, 두 IHC 분석 kappa 값(0.60-0.80)과 비슷한 수치를 보였다.
이 때, tumor grade와 ER status는 큰 상관관계를 가지기에, low-to-intermediate tumor grade를 가진 환자들의 정확도를 높이는 시도를 하였다. 구체적으로 low and intermediate grade 분포가 ER-positive, ER-negative tumor 사이에 골고루 분포하도록 weighted sample 방법을 사용하였다. 그 결과 ER status prediction task에서는 accuracy와 kappa값이 떨어졌다.
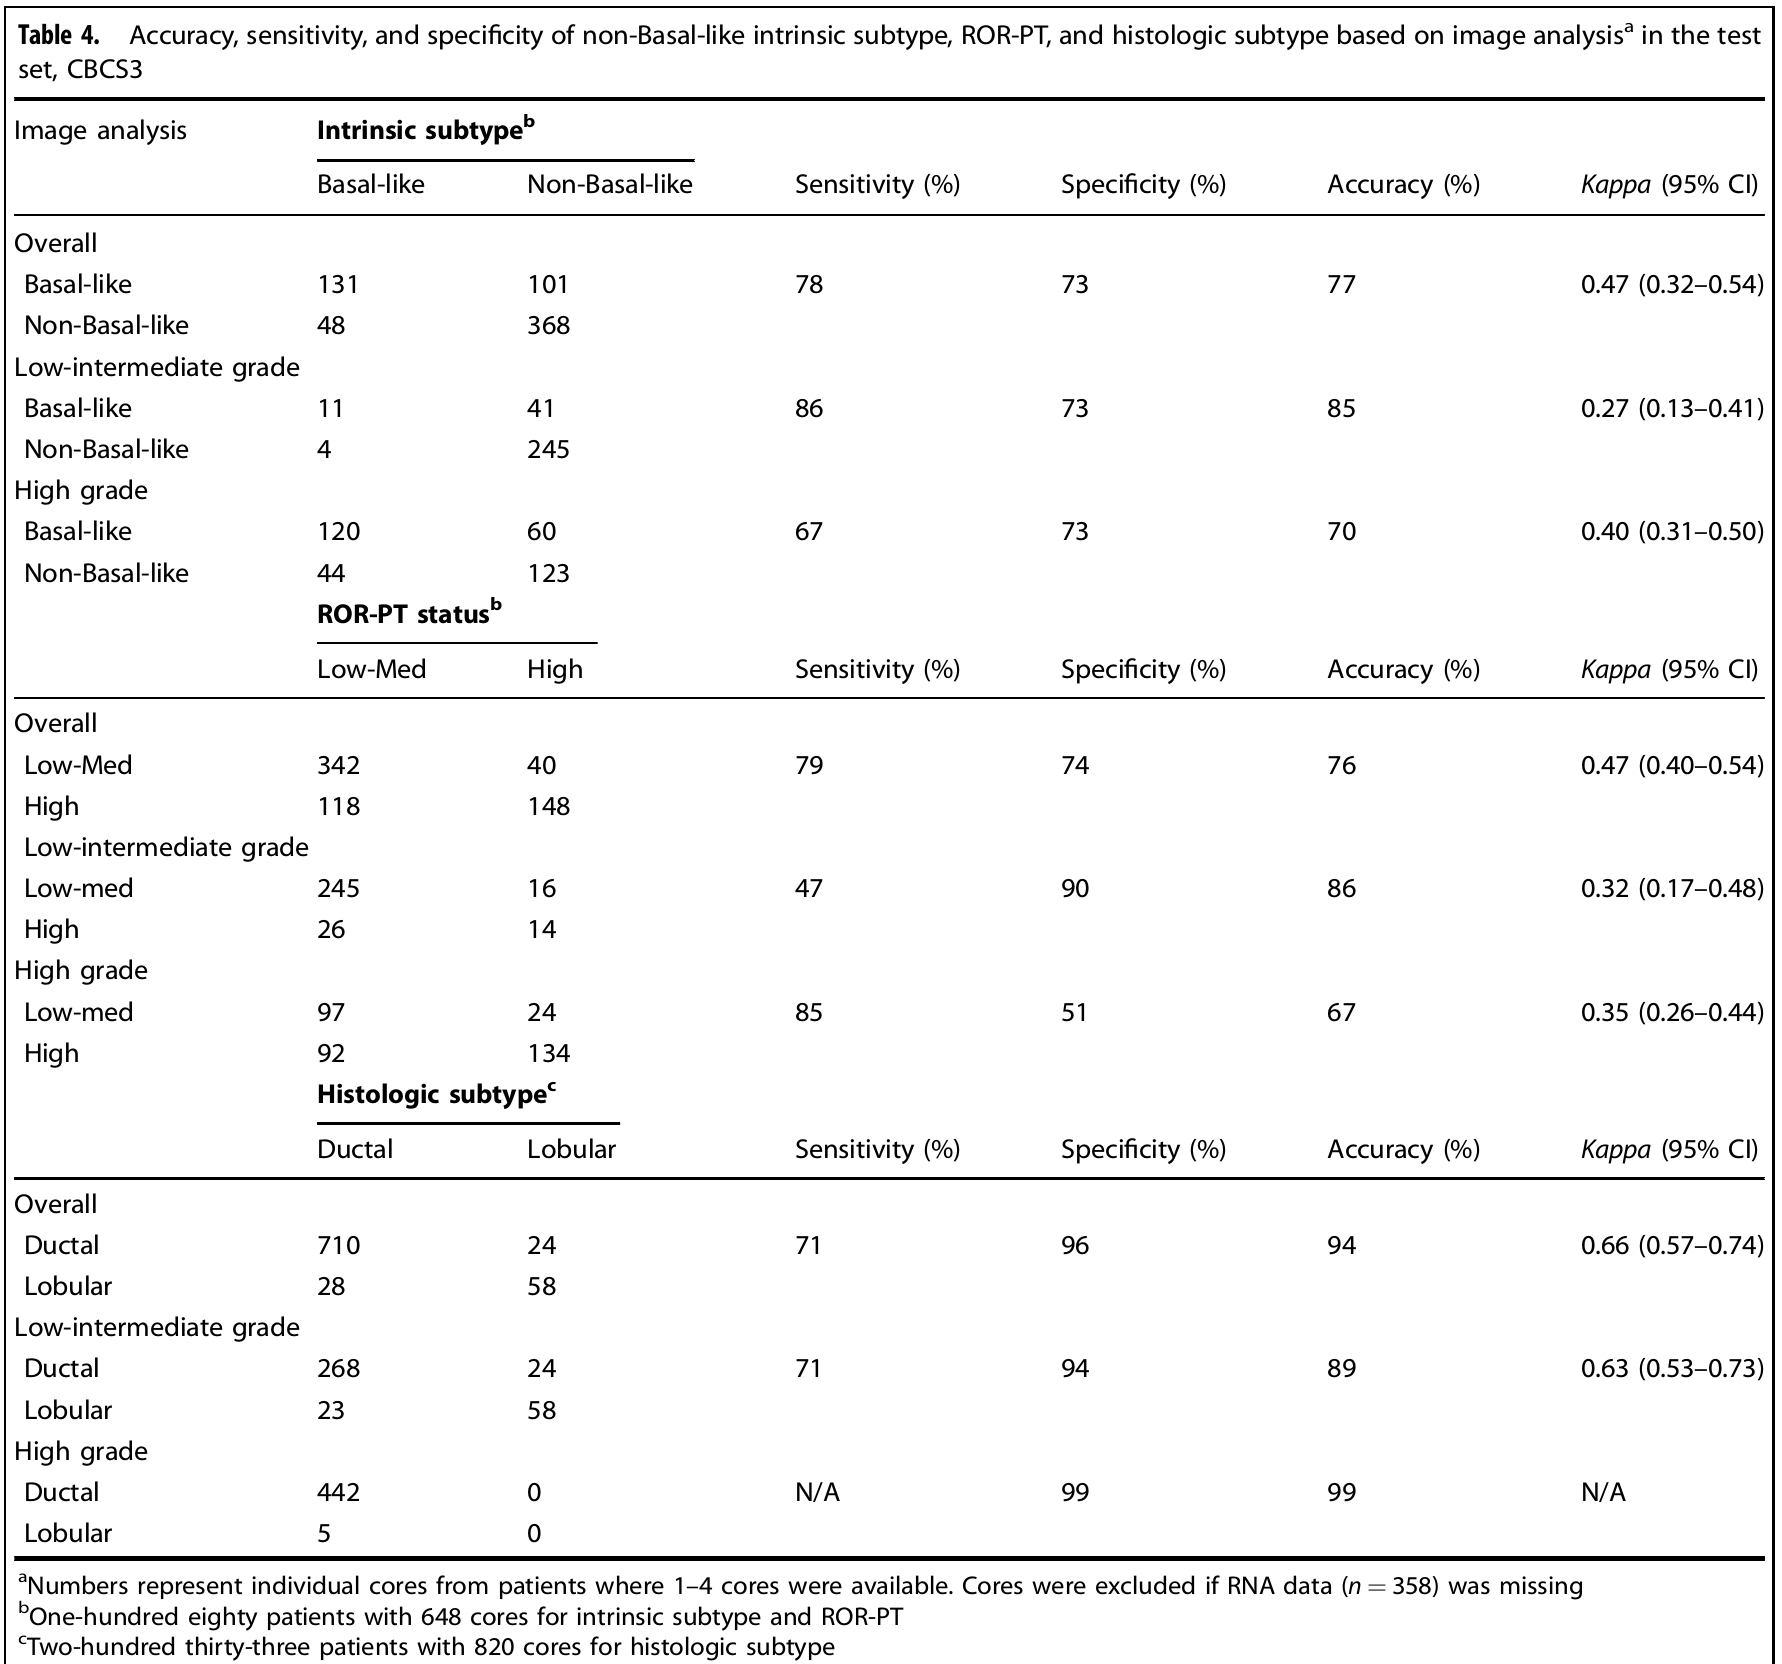
동일한 weighting strategy를 사용하여 intrinsic subtype (basal-like vs non-basal-like PAM50 subtype), ROR-PT status, Histologic subtype을 예측하였다. 그 결과, intrinsic subtype과 ROR-PT status에서 overall group과 high grade group보다 low-intermediate grade group에서 상대적으로 더 높은 accuracy가 측정되었다.
절대적인 값에 대한 평가도 논의되었다. 선행연구에서 intrinsic subtype, ROR-PT status의 두 pathologist 사이의 agreement 값도 낮았고 이번 연구에서도 그러했다고 언급하였다.
Histologic subtype prediction accuracy가 94%로 높았다. 이는 arrangement of epithelial and stromal cell을 잘 잡아내었기에 가능한 것으로 해석하였다.
어떤 clinical factor가 accuracy와 영향이 있는가를 평가하였다. (supple) 그 중 특히 ER status가 Luminal B일 때 정확도가 떨어지는 것을 확인하였다. 이 연구의 sample limitation과 함께 larger sample이나 distinct, image-detectable sample이 필요함을 암시했다.
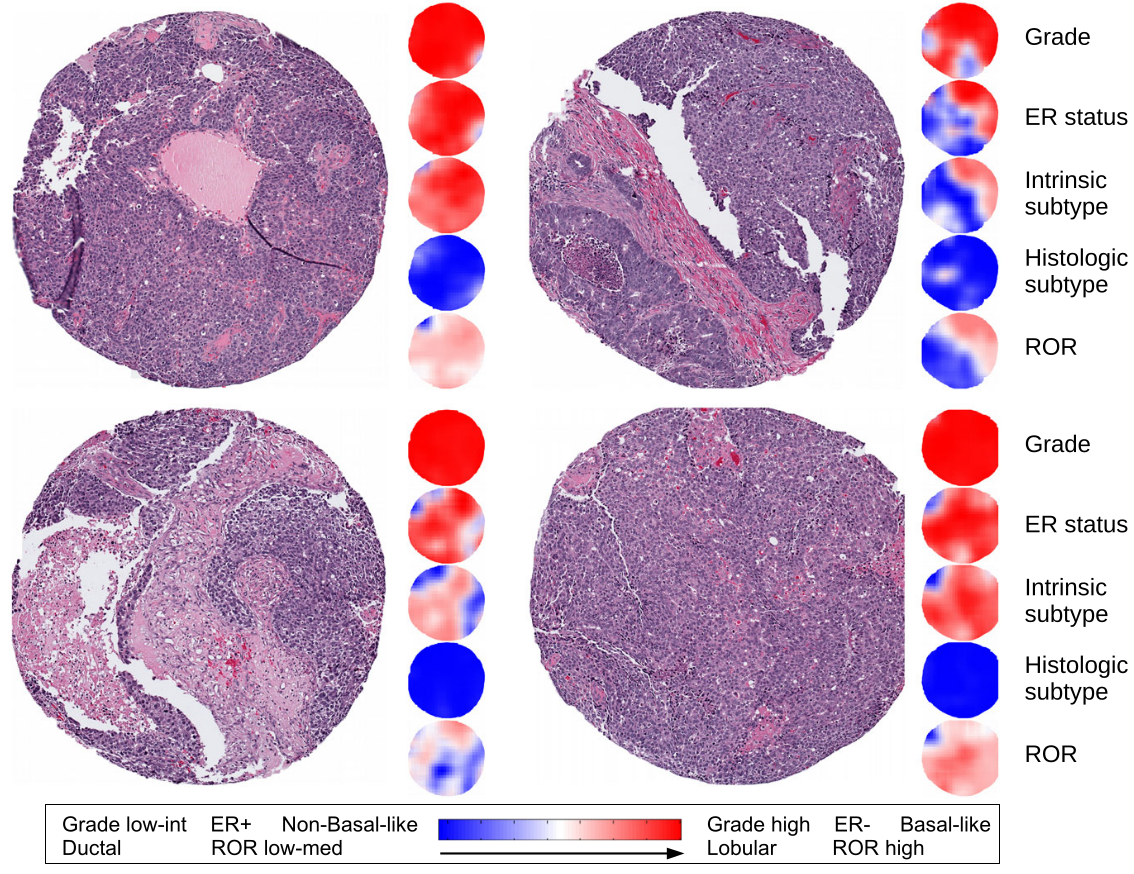
같은 patient의 cores를 통해 class prediction의 성능을 확인하고자 하였다. 우측 상단 core만 나머지 core들의 예측값과 다르게 계산되었다. 이는 intra-tumoral heterogeneity가 존재함을 암시한다.
intra-tumoral heterogeneity: 종양 내 세포들의 유전/표현형 정보가 위치에 따라 다르게 관측되는 것. 전이성 유방암 치료의 장애물이다.
Conclusion
- tile selection: pathologist select the cores
- tile aggregation: linear SVM with isotonic regression 모델을 통해 quantile function을 학습하고 이를 다시 class label 삼아 second SVM classifier에 넣어 overall tumor prediction에 이용함.
분류가 tile selection 및 tile aggregation 이었지만, 핵심적인 내용은 tile aggregation method 였다. 논문 자체도 어려웠지만 Calibration과 quantile function이 낯설어서 이 개념들과 친숙해지는데 더더 걸렸던 것 같다. 또, method 부분 이외의 result & discussion 부분을 어느정도로 힘줘서 읽어야 하는지 감이 잘 안온다. 이번은 일단 힘줘서 읽었는데, 비효율적인 것 같기도 하다. (하지만 안 읽으면 뒷 내용이 이해가 안갈지도..)
다음 리뷰 논문은 couture2018b로 지금 시점에서 이미 어제 읽었다. Quantile function 학습 자체를 MIL pooling에 접목시킨 end-to-end 모델을 제시하였다. 점심 먹고 바로 쓰러 다시 와야지 하핫
궁금했던 점
- Result 2, 3번째 표에서 grade-trained (weighting strategy) 설명이 명확히 이해하지 못했다. Distribution을 임의로 ER-positve/negative tumor가 비슷하게 나오도록 설정했다는 것이 왜 "weighted" 방법인지 잘 모르겠달까..
- Input image size와 관련해서 잘 따라가지 못했다. VGG16의 input은 224x224이고, VGG16의 4th layer를 거쳐나오면 2500x2500이 284x284x512로 나온다고 한다. 또 각 image region은 mean of each CNN feature computed over the region으로 800x800 pixel로 나온다고 한다.. 뭘 CNN에 넣고 뭘 linear SVM에 넣었는지 잘 모르겠다.
참고:
10.1200/jco.2008.18.1370 (ROR)
https://techy8855.tistory.com/29
https://3months.tistory.com/490