TIL / developers tool
Today is Friday, January 28th
TIL = Today I learned
Today's topic I have chose to post a
**developer tools** in korean (개발자 도구)
allows developers to test and debug there codes
fyr) **shortcut key command + opt + i**
Today, I learned how to manipulate and read the contents the points for these categories below:
1/ google: Chrome DevTools
https://developer.chrome.com/docs/devtools/
- For beginners, I think it is very important to know these kinds of resources.
- Full of guides and description of what, where, when, how to learn the purpose of use.
- Accessing it really helps you learn from your mistakes...
- Easy, fast, check for coding
**2/ Class Assignment:**
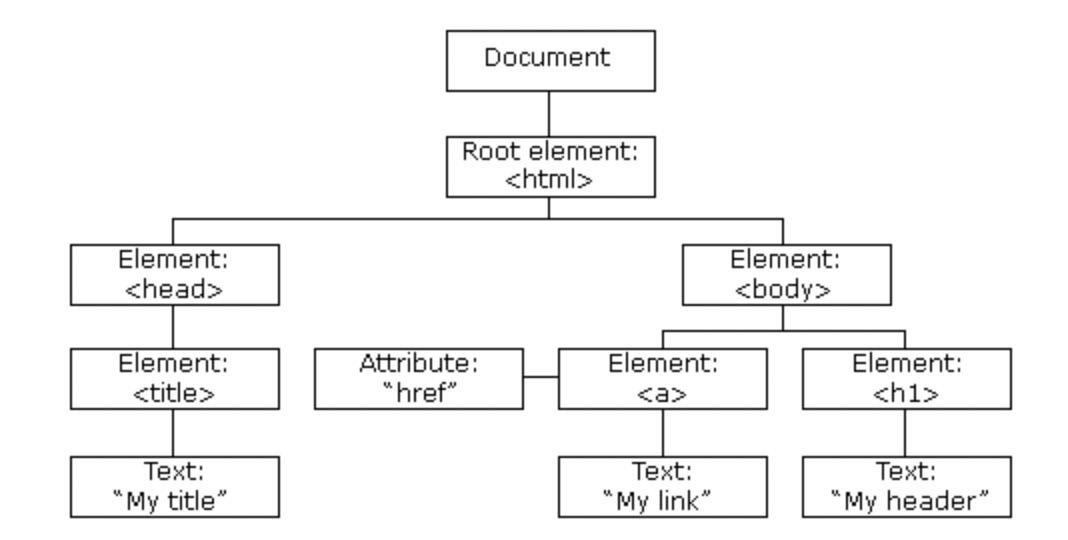
- **Element Panel**
> What is the function of the element panel?
--> Element Panel lets you see everything from the DOM _(Document Object Model) _tree and allows inspect the elements.
==============================
- **Console Panel**
> What is a console panel?
--> Press Command+Option+J (Mac) or Control+Shift+J (Windows, Linux, Chrome OS) to jump straight into the Console panel.
--> Console has 2 main uses:
1/ view logged messages, general reasons...
- making sure that the code is executing the right order
- expecting the value of variables at a certain moment in time
2/ running JavaScript
- Repl = Read–eval–print loop
- you can run JavaScript in the console to interact the page that you're inspecting
==============================
- **Network Panel**
> What is a network panel?
--> inspecting network activity
- record network requests,
- stop request turns grey, means it's no longer recording
the request
-Click Clear Clear on the Network panel to clear all requests from the Requests table.
-Save requests across page loads
To save requests across page loads, check the Preserve log checkbox on the Network panel. DevTools saves all requests until you disable Preserve log.
-Capture screenshots during page load
- Hover over a screenshot to view the point at which that screenshot was captured. A yellow line appears on the Overview pane.
- Click a screenshot's thumbnail to filter out any requests that occurred after the screenshot was captured.
Double-click a thumbnail to zoom in on it.
- Replay XHR request
- To replay an XHR request, right-click the request in the Requests table and select Replay XHR.
- Change loading behavior
- #Emulate a first-time visitor by disabling the browser cache
- Manually clear the browser cache
- To manually clear the browser cache at any time, right-click anywhere in the Requests table and select Clear Browser Cache.
https://developer.chrome.com/docs/devtools/network/reference/
Press Command+E (Mac) or Control+E (Windows, Linux) while the Network panel is in focus.
==============================
- **Application Panel**
-The Application panel provides tools for inspecting and debugging modern web apps (also known as Progressive Web Apps). This includes inspection of service workers and web app manifests.
## Sharing my thoughts...
Personally, I'm a newbie, but as much as I
have begun, a lot of dedication and my pace is very important to learn day-by-day.
"as a life as a developer...
learning to understand terminologies, programs and mental state..."

30기 신윤숙 / FE