주의
2년차 개발자의 메모리 누수 해결 고민 과정을 까먹지 않기 위해 기록한 글 입니다.
다소 미숙하고 허접한 과정일 수 있지만,
더 좋은 아이디어의 영감이 되고자 공유합니다.
댓글창은 언제나 열려있습니다. 감사합니다.
서론
메모리 누수 탐지에 필요한 것들에 대해 얘기해보고자 한다.
본론
현상 재현
디버깅 할 때 제일 중요한 것이다. 근본 원인 파악이 제일 우선이 되고,
현상 재현이 가능하면 반복적인 테스트와 함께 해결책을 찾을 수 있다.

상상하지 말자
개발자는 상상을 현실로 만들어내는 힘이 있다.
그러나 절대 추측하지말고 상상하지 말자, 데이터와 사실로 판단하자.
팩트폭행 툴
다음은 메모리 사용량 데이터와 사실로 판단하는 데에
도움이 되는 리눅스 명령어들이다.
- top
- free
- vmstat
- sar
- topas
- strace (시스템콜 추적)
- ps -p -o rss, vsz, pmem
- 실질적인 의미의 메모리사용률을 구하려면 캐시 영역도 유후 메모리로 봐야 한다.
free -m
total used free shared buff/cache available

Mem: 39700 11617 5147 371 22936 27274

Swap: 0 0 0- 명목메모리 사용률 = used / total = (total - free) / total
- 실질메모리 사용률 = (total - free -buffers - cached ) / total
sar -r 1- total = kbmemfree + kbmemused
- 실제 사용율 = kbmemused / total
- 유효한 %memused 값.
free -mtotal: 설치된 총 메모리 크기.used: 사용중인 스왑 크기 (total - free - buff/cache) (total - available)free: 사용되지 않은 스왑 크기 (total - used - buff/cache)shared: 여러 프로세스에서 사용할 수 있는 공유 메모리.buffers: 커널 버퍼로 사용중인 메모리cache: 페이지 캐시와 slab으로 사용중인 메모리buff/cache: 버퍼와 캐시를 더한 사용중인 메모리.available: swapping 없이 새로운 프로세스에서 할당 가능한 메모리의 예상 크기.- total = used + free + buff /cache
- 실제 사용량 = used + buff/cache
- 실제 사용융 = used / total
- used 값과 buff/cache 값을 더한 값이 실제 사용량
- 유휴 = free
옵션
- [-h] : 사람이 읽기 쉬운 단위로 출력한다.
- [-b | -k | -m | -g] : 바이트, 키비바이트, 메비바이트, 기비바이트 단위로 출력한다.
- [--tebi | --pebi] : 테비바이트, 페비바이트 단위로 출력한다.
- [--kilo | --mega | --giga | --tera | --peta] : 킬로바이트, 메가바이트, 기기바이트, 페타바이트 단위로 출력한다.
- [-w] : 와이드 모드로 cache와 buffers를 따로 출력한다.
- [-c '반복'] : 지정한 반복 횟수 만큼 free를 연속해서 실행한다.
- [-s '초'] : 지정한 초 만큼 딜레이를 두고 지속적으로 실행한다.
- [-t] : 합계가 계산된 total 컬럼 줄을 추가로 출력한다.
프로그램 내의 프로세스 메모리 사용량 확인하기
- sudo cat /proc/{pid}/status
리눅스의 /proc 이하에는 PID번호로 이루어진 Directory는 실시간으로 업데이트 되며, 이하에는 status 라는 파일로 아래와 같은 정보들을 확인할 수 있다.
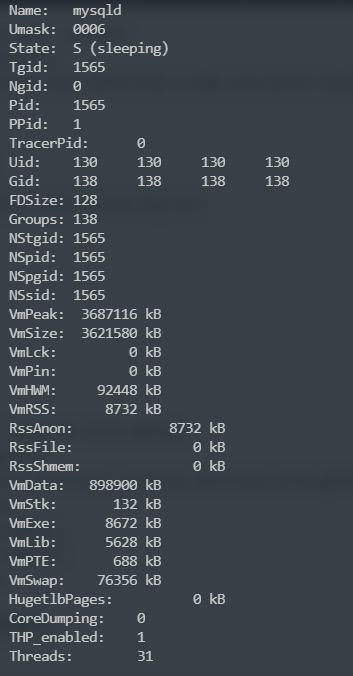
여기서 중요한 정보는VmRSS다.
Resident Set Size: OS에서 확인되는 프로세스의 메모리 사용량이다.
이를 프로세스 내에서 계산할 수 있도록 코드를 짜면 다음과 같다 :
int getProcSelfStatusRSS()
{
  FILE* file = fopen("/proc/self/status", "r"); //pid 값 대신 self를 넣어 코드를 실행하는 프로세스의 pid 입력
  int result = -1;
  char line[128];
  while (fgets(line, 128, file) != NULL)
  {
  	if (strncmp(line, "VmRSS:", 6) == 0) { //6글자 'VmRSS:' 가 있는 라인
  		result = parseLine(line);
  		break;
  }
  fclose(file);
  return result;
}
리턴값을 로그에 출력하고 로그를 파싱하여
그래프를 그릴 수 있도록 python 코드도 짠다.
bash 스크립트로 짜면 멋있었겠지만 어렵다. 그러니까 비슷한 인터프리터 언어 파이썬 코드를 짠다.
import sys
import re
import subprocess

cnt = 0

max_value_coll = []
for longFilePath in sys.argv[1:]:
    cnt += 1
    with open(longFilePath, "r") as log_file:
        log_data = log_file.read()

    log_lines = log_data.strip().split('\n')

    res_size_list = []
    res_change_list = []
    virt_size_list = []
    virt_change_list = []


    for log_line in log_lines:
        res_match = re.search(r'RES (\d+) kB \((-?\d+) kB\)', log_line) //로그 패턴
        virt_match = re.search(r'VIRT (\d+) kB \((-?\d+) kB\)', log_line)
        res_size = 0

        if res_match is not None and virt_match is not None:
            res_size = int(res_match.group(1))

            if (res_size > 0) :
                res_size_list.append(res_size)


    file_name = longFilePath + "." + "resSize"
    with open(file_name, "w") as file:
        for element in res_size_list:
            file.write(str(element) + "\n")

    avg_res_size = sum(res_size_list) / len(res_size_list)

    max_value = max (res_size_list)
    max_value_coll.append(max_value)

    print ("RES max : ", max_value)
    print ("number of sample :", len(res_size_list))
    print ("==================================================")

gnuplot_script = f"""
    set terminal png
    set output '{longFilePath}.resSize.png'
    set ylabel "RES (kB)"
    set yrange[0:{max(max_value_coll) + sum (max_value_coll) / len(max_value_coll) * 0.1* len(sys.argv) }]
    """

plot_commands = []

for i in range(1, len(sys.argv)):
    plot_commands.append (f"'{sys.argv[i]}.resSize' using 1 with line title '{sys.argv[i].split('.mem')[0] + '.mem'}'")

gnuplot_script += "plot " + ", ".join(plot_commands)

gnuplot_script_bytes = gnuplot_script.encode()

process = subprocess.Popen(['gnuplot', '-'], stdin=subprocess.PIPE)
process.communicate(gnuplot_script_bytes)
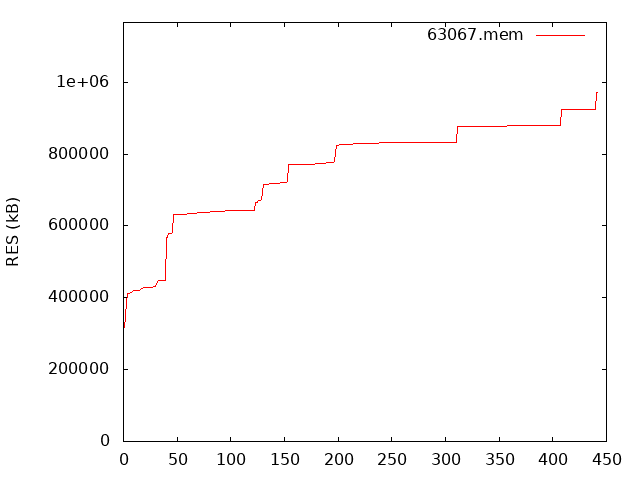
그래프는 CLI 기반의 gnuplot으로 그래프를 출력할 수 있고,
png 파일로도 만들 수 있다.
세부설정으로 스케일도 세팅할 수 있으니 살펴보시길 바란다.
그렇게 그래프를 그리면 아래와 같은 그래프가 출력된다.
결론
다양한 도구로 간편하고 빠르게 메모리 누수 의심 부분 확인하여
실제 메모리 증가 여부를 알 수 있다.
의심 부분을 찾는 법은 다음 글에 이어하도록 하겠다.
참고
https://m.blog.naver.com/kmk1030/221982895216
https://blog.helperchoi.com/36

예술융합형 개발자🎥