정의 (Definition)
Java Hotspot VM의 자동 힙 메모리 관리 프로세스.
객체가 힙 영역에 할당되고, 접근불가 상태가 되면 할당해제를 한다.
접근불가 상태가 뭐야? (Unreachable)
프로세스 내에서 참조되지 않는 객체의 상태를 의미한다.
Nulling a referance
Employee emp=new Employee();
emp=null;
Assigning a reference to another
Employee emp1=new Employee();
Employee emp2=new Employee();
emp1=emp2;//now the first object referred by emp1 is available for garbage collectio
Anonymous Object
new Employee();과정 (Steps)
- Stop The World Event
- 어플리케이션을 멈춤.
- Mark and Sweep Event
- 접근가능한 객체를 마킹(Mark)하고 마킹 되지 않은 객체를 삭제(Sweep) 한다.
- 생존 객체 판단 기법 (Object Liveness Analysis)
- Reference Counting
- 도서관에서 책을 빌린 사람이 몇명인지 확인한다.
- 사람끼리(순환 참조) 책을 빌리면 정확한 수를 알 수 없다. - Tracing Garbage Collection
- 도서관 (root objects - Method area의 static 변수,
Stack의 로컬 변수, Native method stack의 JNI)에서 영수증(reference)을 확인해서 어떤 책이 대여(Reachable) 됐는지 확인.
- 영수증이 없는 책(resource)은 접근불가하므로 마킹되지 않는다.
- 어플리케이션 스레드를 멈춰야 한다.
- Reference Counting
- (Compaction)
- 파편화 된 메모리를 연속적인 블록으로 만드는 과정이다.
전략 (Strategy)
Copying Algorithm을 기반.
1. Heap을 Active 영역과 InActive 영역으로 나누어
Active 영역에만 Object를 할당할 수 있게 하고 Active 영역이 꽉 차게 되면 GC를 수행.
2. GC를 수행하면 Suspend 상태가 되고 살아남은 Live Object를 Inactive 영역으로
Copy 하는 작업을 수행.
약한 세대 가설 (Weak Generational Hypothesis)을 기반.
1. 대부분의 객체는 금방 접근 불가능 상태(unreachable)가 된다.
2. 오래된 객체에서 젊은 객체의 참조는 아주 적게 존재한다.
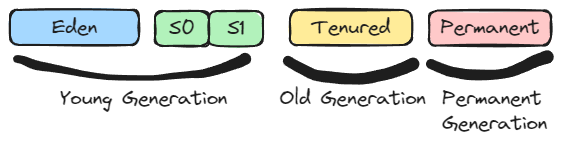
Java 8부터는 MetaSpace가 Permanent Space를 대체한다.
객체를 수명으로 분류한다.
1. Young Generation
- 새롭게 생성된 객체.
- Eden Space에서 생성된다.
- Minor GC로 수집 된다.
1. Old Generation
- 생성된 후, 접근 가능 상태(reachable)를 유지한 객체.
- Major GC로 수집 된다.
기본 과정 (Generational Steps)
- 새로운 객체를
Eden Space에 넣는다. Eden Space가 가득차면 Minor GC가 실행된다.- 접근 가능한 객체는
Survivor Space0으로 이동하고, 접근불가 객체는 수집된다. Eden Space가 가득차면 Minor GC가 실행된다.- 접근 가능한 객체는
Survivor Space1으로 이동하고, 접근불가 객체는 수집된다.
Survivor Space0에 있던 Young Generation 객체는 나이를 먹는다. - 2번을 반복한다.
- Young Generation 객체가 특정 나이에 도달하면 Old Generation이 된다(
promotion).
이렇게 되면 Young Generation은 작은 크기를 가진 메모리,
Old Generation은 큰 크기의 메모리를 가지는 메모리로 분류되는 특성이 있으며
Minor GC와 Major GC 방식에 차이를 만든다.
방식 (Types)
- Serial
- 한 스레드에서 실행되는 GC.
- 아주 긴
Stop the World이벤트 시간. - 힙 영역이 100MB일 때 유용.
- Parallel
- JDK 8부터 기본.
- 다중 스레드 in Minor GC, 단일 스레드 in Major GC.
- 수시로
Stop the World이벤트 실행. - 지연 시간보다 전체적인 처리량 향상을 더 중요하게 생각하는 Backend에 적합.
CMS (Concurrent Mark Sweep)최소시간의Stop the World이벤트를 여러번 실행.수집 작업을 어플리케이션 스레드와 동시에 실행.Compaction이 기본적으로 제공되지 않는다.GUI 애플리케이션에 적합.- DEPRECATED.
- G1
- CMS 대체.
- 최소시간의
Stop the World. - JDK 9부터 기본.
- 힙 영역이 수십 GB 이상일 때, Java 힙의 50% 이상이 live data로 채워질 때 유용.
-live data: Root로부터 참조되는 객체 - Heap 영역을 새롭게 Young Generation과 Old Generation 분산 형태의 Regions로 사용.
- 주로 Young Generation Region을 GC. (Young-Only Phase의 Normal young Collection).
- IHOP을 넘어갈 때 Old Generation Region GC. (Space-Reclamation Phase).
- Old Region은 크기가 커서 여러개의 Region을 차지할수 있다.
- Young Generation 할당 시 크기가 너무 클 경우 바로 Old Generation으로 분류한다. - Runtime에서 영역별 Region 개수 튜닝.
- Shenandoah
- OpenJDK 12에 출시된 Garbage Collector.
- CPU를 더 사용하는 대신
Stop the World이벤트 소요시간 줄임.
- Z
- 10ms 미만의 지연시간.
- -XX:+UseZGC 옵션으로 활성화 가능.
- 애플리케이션 스레드를 안 멈춰도 가능.
- JDK 11 이상 버전만 지원.The Z Garbage Collector (ZGC) is a scalable low latency garbage collector.
ZGC performs all expensive work concurrently,
without stopping the execution of application threads for more than a millisecond.
It is suitable for applications which require low latency.
Pause times are independent of the heap size that is being used. ZGC works well with heap sizes from a few hundred megabytes to 16TB.
출처 : https://wiki.openjdk.org/display/zgc/Main
장점 (Benefit)
Runtime 중 제어 불가능한 메모리를 자동으로 해제 해준다.
실행 전 (Before Trigger)
finalize() method
객체가 가비지 컬렉션으로 수집되기 전에 실행되는 메서드.
실행 (Trigger)
- Allocation Failure
- Heap Size
- 힙 사이즈가 임계점에 도달할 때.
- System.gc()
- 실제 실행되는지는 보장하지 않는다.
- Time-Based
- 시간에 맞춰 실행됨.
왜 알아야 함? (Why)
- Dangling Pointer 방지
- Double free 방지
- 메모리 누수 방지
약한 세대 가설에 따라, JVM의 모든 객체를 마킹하고 압축하는 과정은 실용적이지 않다. 그러므로 접근불가한 객체를 골라내는 과정이 필요하다.
가비지 컬렉션이 어떻게 이루어지는지 알아야 최적화를 이룰 수 있다. 기본 메커니즘 외에 가비지 컬렉션을 제어할 수는 없지만, 코드에 System.gc()나 Runtime.getRuntime().gc()로 힌트를 줄 수 있다. 그러나 실제 실행을 보장하지는 않는다.
최적의 튜닝을 이루기 위해서는Major GC를 짧게 실행해야 한다.
CLI 플래그 (CLI Flags)
- CLI 플래그 설정
- -Xms : 초기 heap 크기.
- -Xmx : 최대 heap 크기.
- -Xmn : Young Generation 크기.
- -XX: 가비지 콜렉터 방식.
- -XX:+PrintGCDetails : 얼마나 많은 메모리가 해제됐는지 로그.
- -XX:+PrintGCDateStamps: 로그 생성.
- -xloggc: 로그파일 생성.
java -Xmx12m -Xms3m -Xmn1m -XX:+UseSerialGC -XX:+PrintGCDetails -XX:+PrintGCDateStamps -Xloggc:/opt/app/gc.log -jar c:\javademos\demo\jfc\Java2D\Java2demo.jarGC 분석 도구 (Tool)
Universal JVM GC analyzer - Java Garbage collection log analysis made easy (gceasy.io)
https://github.com/scouter-project/scouter
-
Heap Dump – JVM의 힙 영역에서 사용 중인 모든 객체의 스냅샷.
-
NetBeans Profiler – supports Java SE, Java FX, EJB, mobile applications, and Web applications and could be used to monitor memory, threads and CPU resources.
-
JProfiler – a thread, memory and CPU profiling tool that can also be used to analyze memory leaks and other performance bottlenecks.
-
GC Viewer – an open-source tool that allows you to easily visualize information produced by JVM. You can use GC Viewer to see performance metrics related to garbage collection, including accumulated pauses, longest pauses and throughput. Aside from enabling you to run garbage collection, you can also use this tool to set up the preliminary heap size.
-
VisualVM – based on the NetBeans platform, VisualVM is an easily extensible tool using various plugins to give you detailed data on your applications for monitoring both remote and local apps. You can get memory profiling and manually run the garbage collector using this tool.
-
Patty in action – another open-source tool that you can use as a profiling tool to give you target and drilled down profiling. You can use this tool to analyze heaps.
-
JRockit – a proprietary solution from Oracle, JRockit is for Java SE applications that may be used to predict latency, visualize garbage collection and sort through memory-related issues.
-
GCeasy – GCeasy is a tool that analyzes logs related to garbage collection and is an easy way to detect memory leak problems when analyzing garbage collection logs. Another reason to use GCeasy is that it is available online; there is no need to install it on your machine to use it.
참고
Java Garbage Collection Basics (oracle.com)
Java Memory Leaks: Solutions, Tools, Tutorials & More (stackify.com)
Java Garbage Collection (naver.com)
