react-apexchart 로 라인차트 위 annotation을 보여주기 위해 옵션을 사용하는 과정에서 에러가 발생했다.
쉽게 접근할 수 있는 예제에서는 차트 렌더링 시, annotation 이 animation 뒤에 이쁘게 그려지지만, 실제로 작업했을 때는 제대로 그려지지 않았다.
처음에는 옵션값문제인 줄 알았으나, 간헐적으로 차트 위에 annotation 이 그려지는 것을 보고 렌더링 문제라고 판단했다.
정확히는 annotation 의 선이나, 마커는 문제없이 위치했고 label 에서 글자도 잘 그려졌다. background 가 문제였다.
label 의 배경과 글자가 따로 움직였다. 배경이 못따라오는 것 같은.. 그런느낌이었다.
차트의 홈버튼을 눌러서 초기화를 시켜주거나, 줌기능을 통해 차트를 건드리면 제대로 그려졌다.
차트를 다시한번 렌더링 시켜야 되는 것 같았다.
렌더링 순서 문제를 해결하기 위해 annotation 이 그려지는 순서를 가장 마지막으로 하기 위해 찾아봤다.
가장 처음엔 apexchart 의 options 중 events 에서 시도했다.
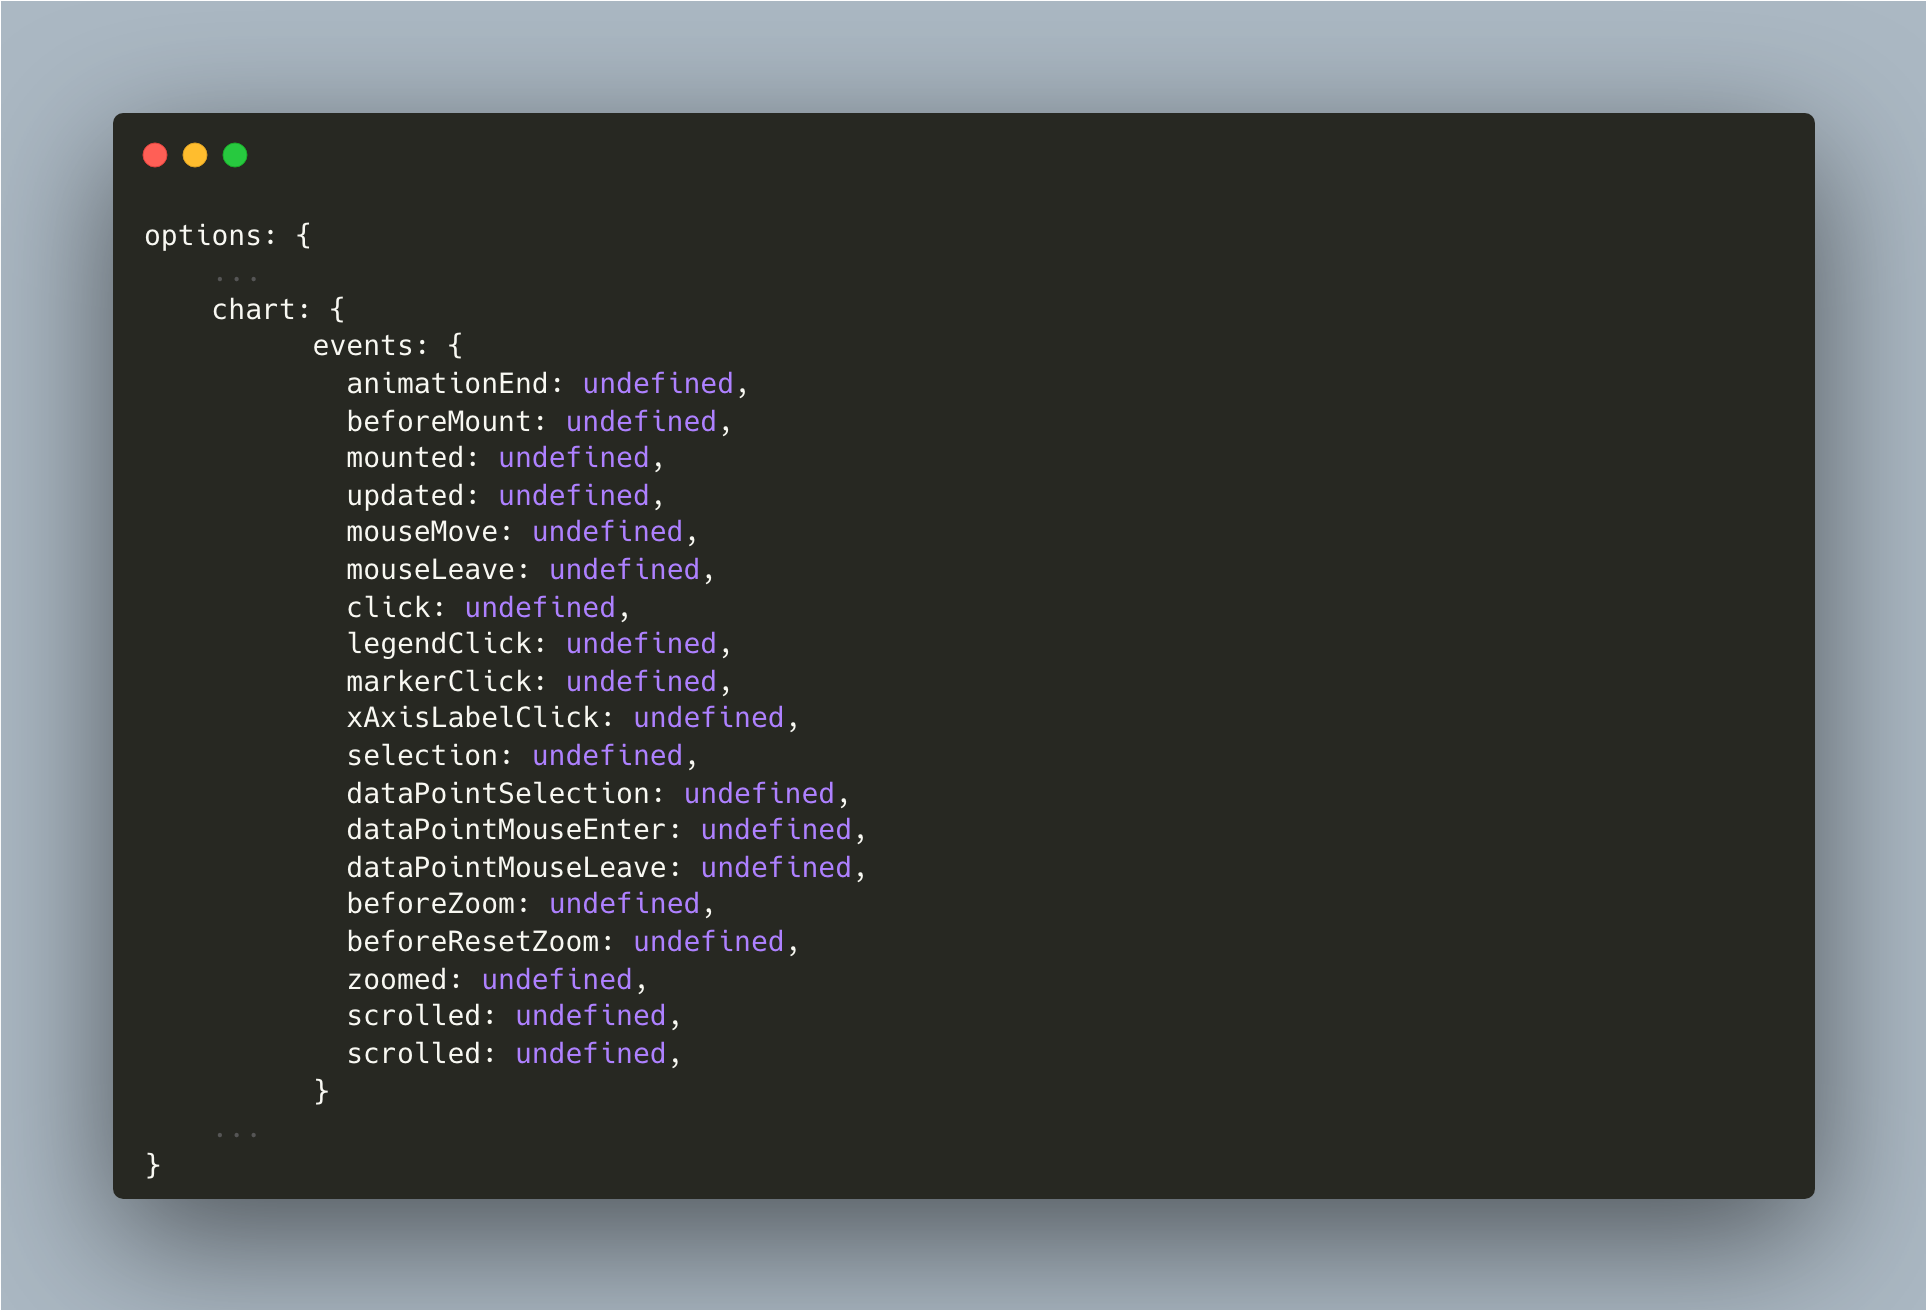
options 내부 default 값은 아래와 같다.
options: {
    ...
    chart: {
          events: {
            animationEnd: undefined,
            beforeMount: undefined,
            mounted: undefined,
            updated: undefined,
            mouseMove: undefined,
            mouseLeave: undefined,
            click: undefined,
            legendClick: undefined,
            markerClick: undefined,
            xAxisLabelClick: undefined,
            selection: undefined,
            dataPointSelection: undefined,
            dataPointMouseEnter: undefined,
            dataPointMouseLeave: undefined,
            beforeZoom: undefined,
            beforeResetZoom: undefined,
            zoomed: undefined,
            scrolled: undefined,
            scrolled: undefined,
          }
    ...
}
위 옵션중에서 mounted 혹은 animationEnd 을 이용해보려 했다.
mounted 는 차트가 화면에 그려진 후 실행하는 함수를 적용할 수 있고,
animationEnd 는 애니메이션이 끝나고 난 후 실행하는 함수를 적용할 수 있다.
둘 다 한번씩 사용해서 차트로 직접 접근을 해보려 했으나 마음처럼 되지 않았다.
apexchart 의 Methods 중에는 updateOptions 이 있다.
예제는 아래와 같다.
var chart = new ApexCharts(el, options);
chart.updateOptions({
  xaxis: {
    labels: {
      show: false
    }
  },
  yaxis: {
    min: 20,
    max: 100
  }
})
이 updateOptions 을 이용해서 차트 애니메이션이 끝난 뒤 annotation 옵션을 추가할 목적이었다.
하지만 updateOptions 는 javascript 로 apexchart 를 사용할 때 구현할 수 있었다.
물론 react 에서도 같은방법으로 할 수 있으나, react 스럽게 하고 싶어서 더 찾아봤다.
너무 어렵게만 생각했는지 결론은 간단했는데, 지금까지 const 로 변동값 없이 지정하던 options 를 useState 로 set 해주고 조건에 따라 업데이트 함으로써 문제를 해결했다.
