늘 그렇듯 iris data를 불러와준다.
0. 개요
본 글에서는 zscore를 이용하여 이상치를 탐색하는 작업을 사용한다.
이름에서 알 수 있듯 z-score는 정규분포에서 유래된다. 데이터에 평균을 빼고 표준편차를 나눴을 때 나오는 값으로, 보통 아래와 같이 추정한다.
- +/- 1 : 68% 이내
- +/- 2 : 95% 이내
- +/- 3 : 99.7% 이내
간단한 데이터로 예시를 들자면
import random
import numpy as np
import zscore
import plotly.express as px

random.seed(819)
# 정규분포에서 데이터를 무작위로 생성한다
random_data = np.random.randn(10000)

# zscore 함수를 이용하여 z_scores를 생성한다.
z_scores = zscore(random_data)

# threshold 값보다 큰 친구들을 전부 outlier로 배정한다(True : outlier)
threshold = 1 # or 2, 3
outliers = (np.abs(z_scores) > threshold)

fig = px.histogram(random_data, nbins = 200, color = outliers)
fig.show()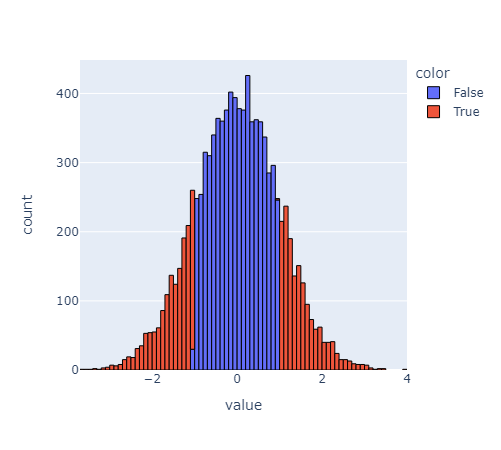
- 빨간색으로 칠해진 부분이 threshold를 1로 잡았을 때의 outlier다.
- threshold를 키울수록 점점 outlier가 줄어드는 모습을 볼 수 있다.
1. 데이터 불러오기(iris)
from sklearn.datasets import load_iris

iris = load_iris()

data = iris.data
target = iris.target

import pandas as pd

iris_df = pd.DataFrame(data, columns = iris.feature_names)
iris_df['target'] = target

iris_df.columns

# 이 중 'sepal length (cm)' 값을 이용해서 진행한다.
2. zscore로 이상치 탐색
2. 1. 직접 계산
test_data = iris_df['sepal length (cm)']
data_mean = np.mean(test_data)
data_std = np.std(test_data)

z_score = (test_data - data_mean)/data_std
threshold = 1
outliers = (np.abs(z_score) > threshold)
2.2 zscore 함수를 이용해서 계산 :)
test_data = iris_df['sepal length (cm)']
z_score = zscore(iris_df['sepal length (cm)'])

threshold = 1 # 2 or 3 or ....
outliers = np.abs(z_score) > threshold
zscore 이용한 이상치 탐색(2)에선 앞서 구한 outlier들을 plotly를 이용한 시각자료를 사용하여 어떤 점인지 파악한다.

Good afternoon, Good evening and Good night