counts = review_null.review_score.value_counts()

fig, ax = plt.subplots()
bars = ax.bar(counts.index, counts.values)

plt.title('리뷰 안쓴 평점 분포')

for bar in bars:
    height = bar.get_height()
    ax.text(bar.get_x() + bar.get_width() / 2, height, str(int(height)), ha='center', va='bottom')

plt.show()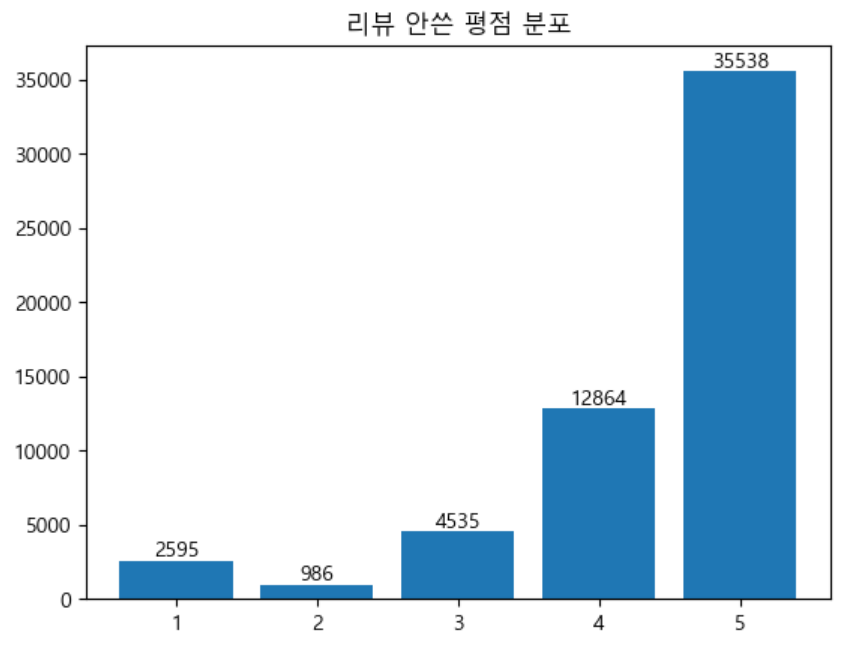

하하...하.