xvalues = np.array([0, 1, 2, 3, 4])
yvalues = np.array([0, 1, 2, 3, 4])
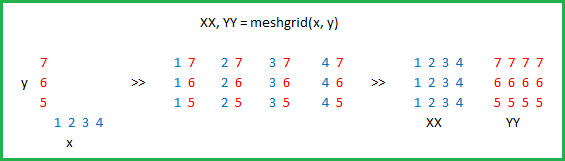
xx, yy = np.meshgrid(xvalues, yvalues)
plt.plot(xx, yy, marker ='.', color='k', linestyle='none')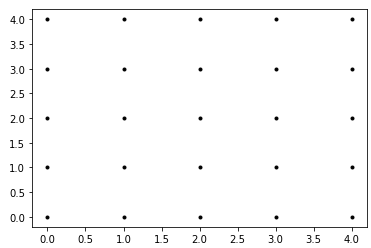
※ 예측값에 대한 시각화 (meshgrid -> contour)
# 퍼셉트론을 생성한다. tol는 종료 조건이다. random_state는 난수의 시드이다.
from sklearn.linear_model import Perceptron
clf = Perceptron(tol=1e-3, random_state=0)

# 뭉쳐진 데이터를 만든다. 샘플의 개수는 총 100개, 클러스터의 개수는 2개이다.
from sklearn.datasets import make_blobs
X, y = make_blobs(n_samples=100, centers=2)
clf.fit(X, y)

from sklearn.metrics import accuracy_score
print(accuracy_score(clf.predict(X), y))

# 데이터를 그래프 위에 표시한다.
plt.scatter(X[:, 0], X[:, 1], c=y, s=100)   # c: color, s : maker size
plt.xlabel("x1")
plt.ylabel("x2")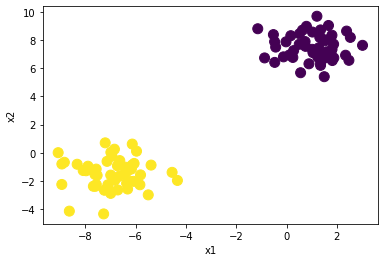
# 데이터에서 최소 좌표와 최대 좌표를 계산한다.
x_min, x_max = X[:, 0].min() - 1, X[:, 0].max() + 1
y_min, y_max = X[:, 1].min() - 1, X[:, 1].max() + 1

# 0.1 간격으로 메쉬 그리드 좌표를 만든다.
xx, yy = np.meshgrid(np.arange(x_min, x_max, 0.1), np.arange(y_min, y_max, 0.1))
#>> xx.shape (161, 142)

# 메쉬 그리드 데이터에 대하여 예측을 한다.
# ravel : 평평하게 만들기, flatten과 유사
Z = clf.predict(np.c_[xx.ravel(), yy.ravel()]).reshape(xx.shape)
#>> array([1,1,1,...,0,0,0]).reshape(xx.shape)

# 컨투어를 그린다.
plt.contourf(xx, yy, Z, alpha=0.4)
plt.show()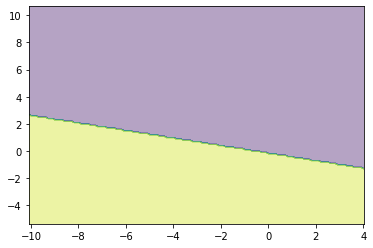
.jpg)
ML/DL swimmer