SELF EXPORT
prometheus_target_interval_length_seconds
- actual amount of time between target scrapes
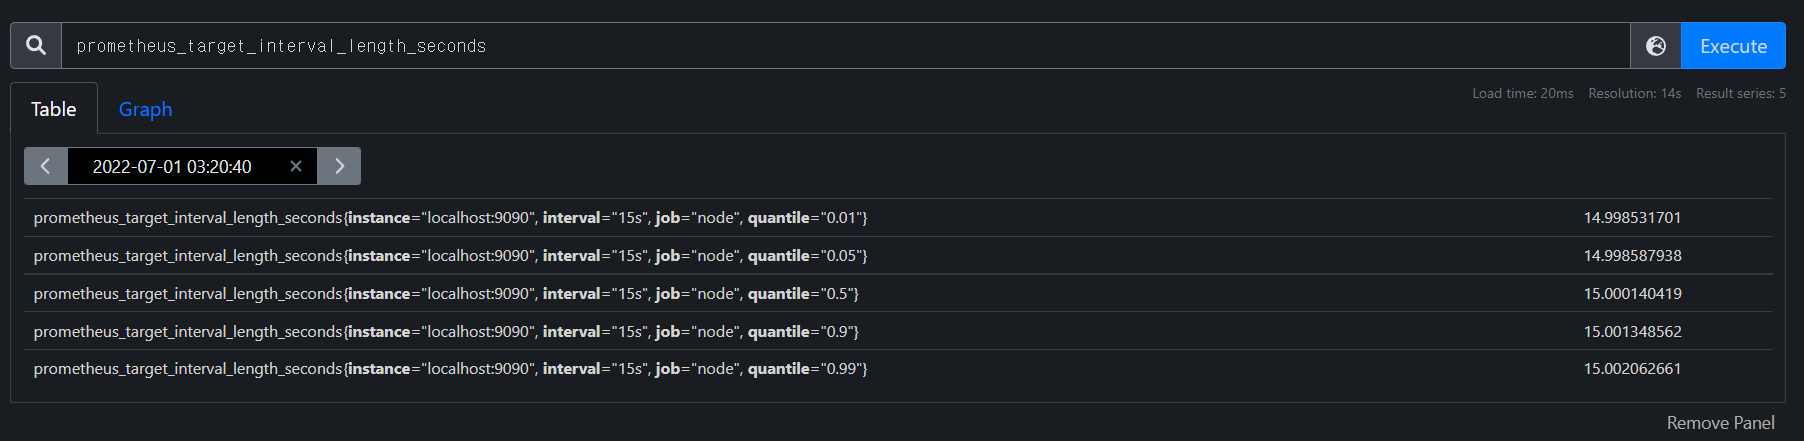
보면 labels가 다 다른데, 각각 latency percentiles와 target group intervals에 맞게 뜬다.
If we are interested only in 99th percentile latencies, we could use this query:
prometheus_target_interval_length_seconds{quantile="0.99"}
count
위에서 언급한 prometheus_target_interval_length_seconds 의 개수를 세고 싶으면
count(prometheus_target_interval_length_seconds)위처럼 count쓰면 된다.
저건 returned time series 세는 것
graph expressions
rate(prometheus_tsdb_head_chunks_created_total[1m])
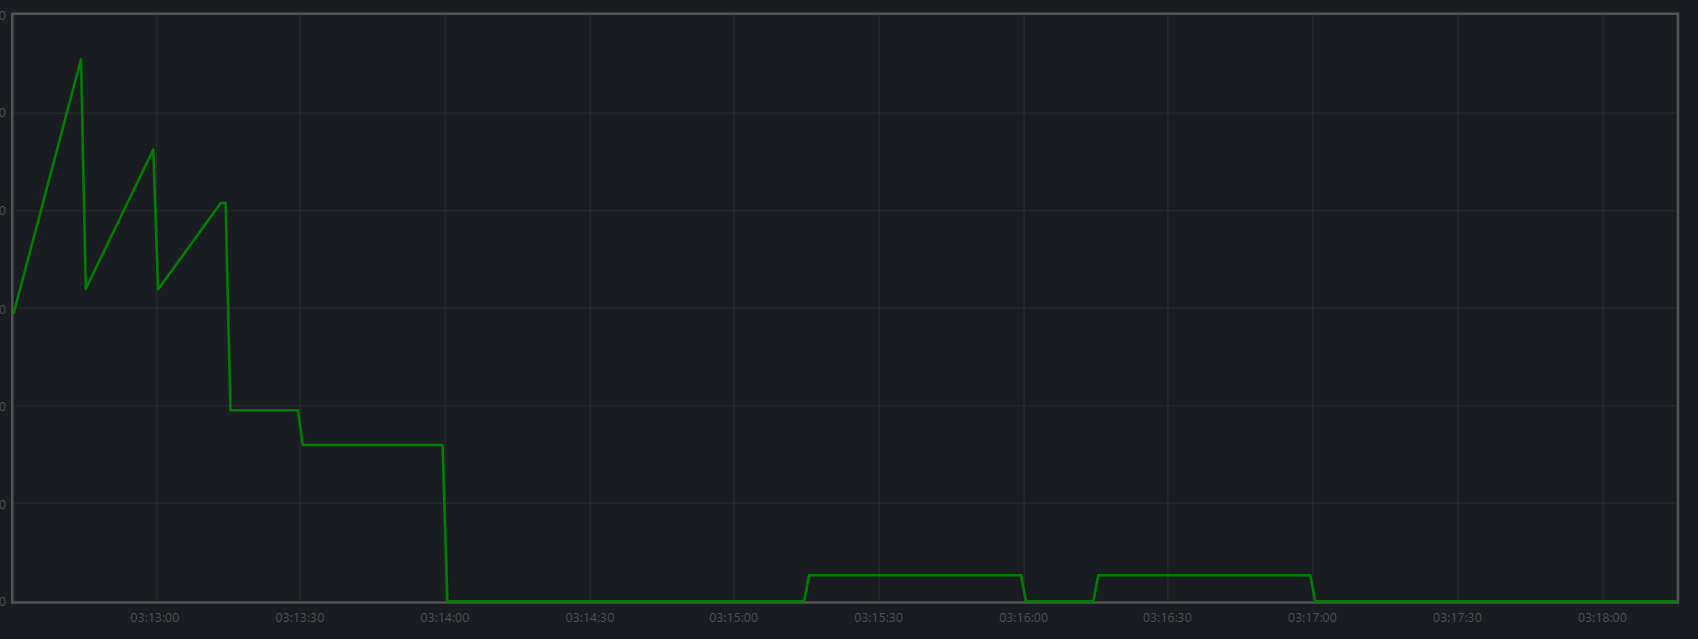
위를 execute하면 이런식으로 그래프를 보여준다.
- tsdb : time series database
Prometheus has a sophisticated local storage subsystem. For indexes, it uses LevelDB. For the bulk sample data, it has its own custom storage layer, which organizes sample data in chunks of constant size (1024 bytes payload). These chunks are then stored on disk in one file per time series.
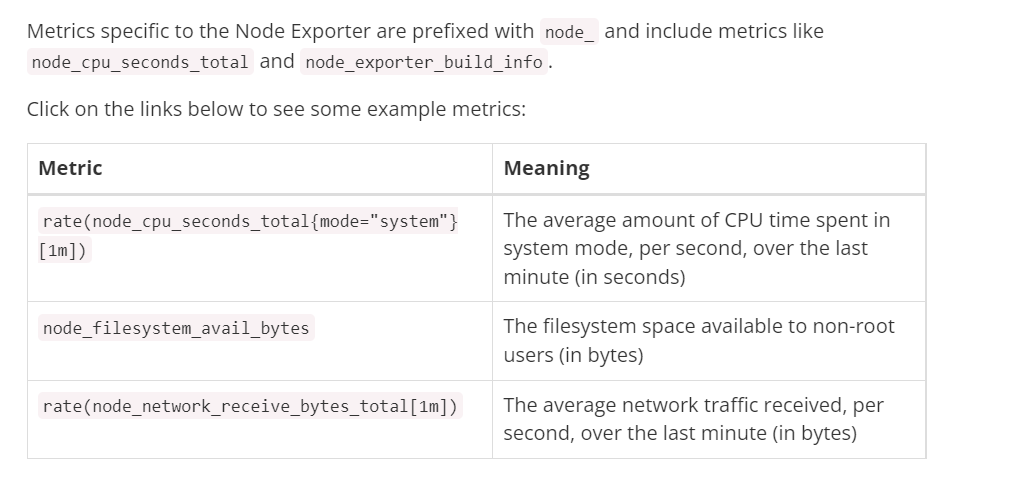
Node exporter specifically