Metric - counter, histogram type
Counter
Prometheus documentation, a Counter is a single, monotonically increasing, cumulative metric.
It’s monotonically increasing, so it can only increase, usually one-by-one.
ex)
The total amount of HTTP requests
The total amount of log messages
The total amount of job executions
metric that go up and down = gauge
PromQL functions of counter metric
rate: 범위 시간당 !초당! 호출량
-
1분동안 60번 호출되었으면 대략 1tps가 나옴
-
alert를 정의할 때나, 느리게 변화하는 카운터를 그래프로 표현할 때 가장 적합
ex)rate(http_requests_total{job="api-server"}[5m])
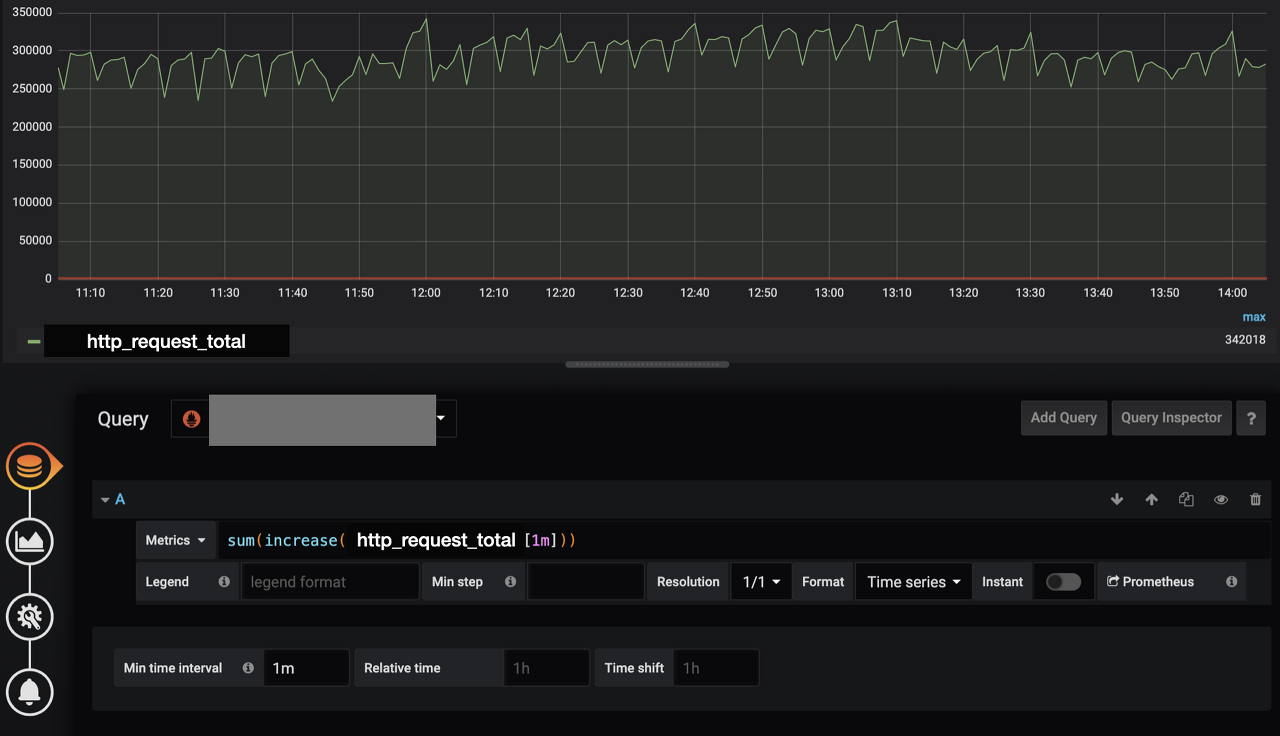
increase: 범위 시간당 증가율
- 1분동안 60번 호출되었으면 대략 60이 나옴
실제 호출 횟수를 그래프로 그리고 나타내고 싶을때는 increase를 사용하면 됨 - increase 메서드로 호출된 값을 그라파나로 그리고 싶을때는 반드시 min time interval을 단위시간(여기서는 1m)으로 설정합니다. 그래야지만 정확한 데이터(min, max, avg)를 단위 시간을 기준으로 얻을 수 있음
irate
- range 벡터 안에 있는 시계열의 초당 순간 변화율을 계산
변화율은 마지막 데이터 포인트 두 개를 가지고 계산 - 카운터리셋등(monotonicity)가 깨졌을 땐 자동으로 보정됨
아래예제 표현식은 range 벡터에 있는 시계열마다 최대 5분 전까지 조회해서 가장 최근 데이터 포인트 2개를 찾고, 초당 HTTP 요철 비율을 반환한다.
irate(http_requests_total{job="api-server"}[5m])- irate는 변덕스럽고 빠르게 변화하는 카운터를 그래프로 표현할 때만 사용하는게 좋음
- alert나 느리게 변화하는 카운터에는 rate를 사용해라
resets
- 입력 시계열마다 지정한 시간 범위 내에서 카운터를 리셋한 횟수를 instant 벡터로 반환함
- 연속한 두 개의 샘플 값을 비교해서 값이 감소했다면 카운터 리셋으로 해석한다.
- 카운터에만 사용해야 함
https://godekdls.github.io/Prometheus/querying.functions/#irate
https://blog.voidmainvoid.net/449
https://levelup.gitconnected.com/prometheus-counter-metrics-d6c393d86076
https://www.innoq.com/en/blog/prometheus-counters/
Histogram
- 값의 범위로 구성되어 있으며,
- "le" 라는 이름의 라벨을 가지는 bucket에 지금까지 관측된 값을 포함시켜 누적 히스토그램을 반환
- 히스토그램과 4분위수 (quantile) 함수를 사용하면 중앙값으로부터 N%에 해당하는 값이 얼마나 관측되었는지를 얻을 수 있음
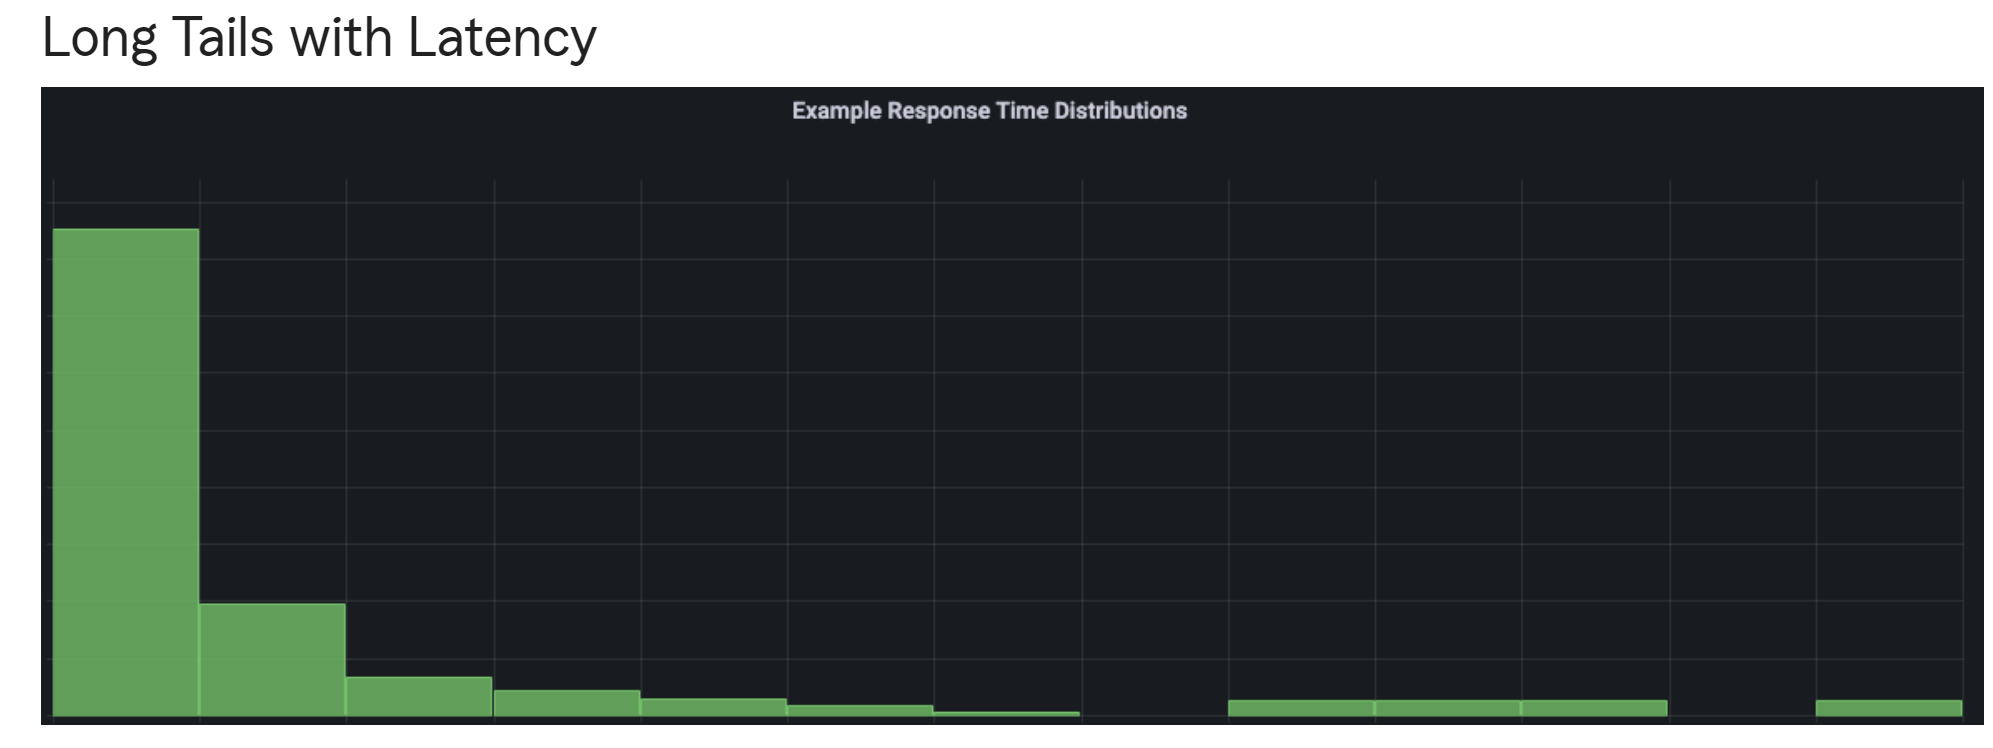
예를 들어, histogram_quantile(0.99, ) 는 하위 99%에 해당하는 하는 임계점 값을 반환한다. - often used to measure request duration or response size.
quantile은 0~1 percentage는 0~100 - Latency measure하기 적합
https://m.blog.naver.com/PostView.naver?isHttpsRedirect=true&blogId=alice_k106&logNo=221535575875
One big advantage of histograms is that they can be aggregated. The following query returns the 99th percentile of response time across all APIs and instances:
histogram_quantile(0.99, sum by (le) (rate(http_request_duration_seconds_bucket[5m])))histogram_quantile
-
This function will provide us the ability to create an estimate of the latency at a specific percentile.
To compute the 99th percentile (0.99 quantile) of response time for the add_product API running on host1.domain.com, you would use the following query:
histogram_quantile(0.99, rate(http_request_duration_seconds_bucket{api="add_product", instance="host1.domain.com"}[5m]))https://engineering.statefarm.com/blog/observing-latency-tail/
번외: Gauge
delta, idelta, deriv, predict_linear
https://promlabs.com/blog/2020/09/25/metric-types-in-prometheus-and-promql
https://www.timescale.com/blog/four-types-prometheus-metrics-to-collect/