📌 랜덤 포레스트
✅ 개요
-
배깅의 대표적인 알고리즘
-
앙상블 알고리즘 중 비교적 빠른 수행 속도를 가지고 있으며, 다양한 영역에서 높은 예측 성능을 보이고 있다.
-
여러 개의 결정 트리 분류기가 전체 데이터에서 배깅 방식으로 각자의 데이터를 샘플링해 개별적으로 학습을 수행한 뒤 최종적으로 모든 분류기가 보팅(소프트 보팅)을 통해 예측 결정을 하게 된다.
-
서브세트 데이터는 부트스트래핑으로 데이터가 임의로 만들어진다.
- 서브세트의 데이터 건수는 전체 데이터 건수와 동일하지만, 개별 데이터가 중첩되어 만들어진다.
✅ 실습
-
RandomForestClassifier: 랜덤 포레스트 기반의 분류를 지원-
n_estimators: 결정 트리의 개수 (default=100) -
max_features: 최적의 분할을 위해 고려할 최대 피처 개수 (default='sqrt') -
max_depth: 트리의 최대 깊이, 과적합 제어 -
min_samples_leaf: 리프 노드가 되기 위한 최소한의 샘플 데이터 수, 과적합 제어
-
from sklearn.ensemble import RandomForestClassifier
from sklearn.metrics import accuracy_score
import pandas as pd
import warnings
warnings.filterwarnings('ignore')

# 결정 트리에서 사용한 get_human_dataset()을 이용해 학습/테스트용 DataFrame 반환
X_train, X_test, y_train, y_test = get_human_dataset()

# 랜덤 포레스트 학습 및 테스트 데이터 세트로 예측 성능 평가
rf_clf = RandomForestClassifier(random_state=0)
rf_clf.fit(X_train, y_train)
pred = rf_clf.predict(X_test)
accuracy = accuracy_score(y_test , pred)
print('랜덤 포레스트 정확도: {0:.4f}'.format(accuracy))

# 하이퍼 파라미터 튜닝
from sklearn.model_selection import GridSearchCV

params = {'n_estimators': [100],
    	  'max_depth': [6, 8, 10, 12],
    	  'min_samples_leaf': [8, 12, 18],
    	  'min_samples_split': [8, 16, 20]}

# RandomForestClassifier 객체 생성 후 GridSearchCV 수행
rf_clf = RandomForestClassifier(random_state=0, n_jobs=-1) # n_jobs=-1: 모든 CPU 코어를 이용해 학습
grid_cv = GridSearchCV(rf_clf , param_grid=params , cv=2, n_jobs=-1 )
grid_cv.fit(X_train , y_train)

print('최적 하이퍼 파라미터:\n', grid_cv.best_params_)
print('최고 예측 정확도: {0:.4f}'.format(grid_cv.best_score_))
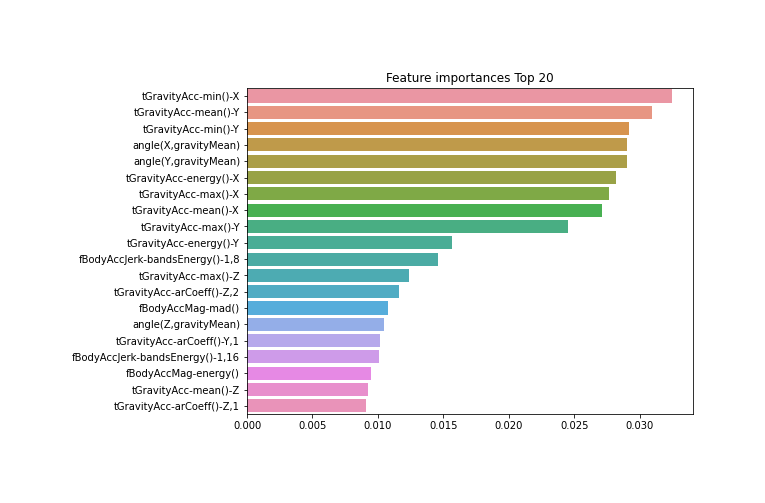
# 최종 모델
rf_clf1 = RandomForestClassifier(n_estimators=300, max_depth=10, min_samples_leaf=8, min_samples_split=8, random_state=0)
rf_clf1.fit(X_train, y_train)
pred = rf_clf1.predict(X_test)
print('예측 정확도: {0:.4f}'.format(accuracy_score(y_test, pred)))

# 피처 중요도 시각화
import matplotlib.pyplot as plt
import seaborn as sns
%matplotlib inline

ftr_importances_values = rf_clf1.feature_importances_
ftr_importances = pd.Series(ftr_importances_values,index=X_train.columns)
ftr_top20 = ftr_importances.sort_values(ascending=False)[:20]

plt.figure(figsize=(8,6))
plt.title('Feature importances Top 20')
sns.barplot(x=ftr_top20 , y = ftr_top20.index)
plt.show()
[참고]
https://scikit-learn.org/stable/modules/generated/sklearn.ensemble.RandomForestClassifier.html

열정 가득한 공간