ref.
https://towardsdatascience.com/how-do-you-know-you-have-enough-training-data-ad9b1fd679ee
There is some debate recently as to whether data is the new oil [1] or not [2].
Whatever the case, acquiring training data for our machine learning work can be expensive (in man-hours, licensing fees, equipment run time, etc.).
Thus, a crucial issue in machine learning projects is to determine how much training data is needed to achieve a specific performance goal (i.e., classifier accuracy).
In this post, we will do a quick but broad in scope review of empirical and research literature results, regarding training data size, in areas ranging from regression analysis to deep learning.
The training data size issue is also known in the literature as sample complexity.
최근 데이터가 새로운 석유인지 아닌지([1], [2])에 대한 논쟁이 있습니다.
어떤 경우이든 기계 학습 작업에 대한 학습 데이터를 얻는 데는 많은 시간이 소요될 수 있습니다. (인력, 라이선스 비용, 장치 실행 시간 등)
따라서 머신러닝 프로젝트에서 중요한 문제는 특정 성능 목표 (예 : 분류기 정확도)를 달성하는 데 필요한 학습 데이터의 양을 결정하는 것입니다.
이 게시물에서는 회귀 분석부터 딥러닝에 이르는 영역까지의 학습 데이터 크기와 관련한 경험적 및 연구 문헌 결과에 대해 빠르고 광범위하게 검토합니다.
학습 데이터 크기 문제는 문헌에서 샘플 복잡성으로도 알려져 있습니다.
[1] The World’s Most Valuable Resource Is No Longer Oil, But Data, https://www.economist.com/leaders/2017/05/06/the-worlds-most-valuable-resource-is-no-longer-oil-but-data May 2017.
[2] Martinez, A. G., No, Data Is Not the New Oil, https://www.wired.com/story/no-data-is-not-the-new-oil/ February 2019.
Specifically, we will:
· Present empirical training data size limits for regression and computer vision tasks.
· Given the desired power of a statistical test, discuss how to determine sample size. This is a statistic topic; however, given its closeness to the determination of training data size in machine learning, it is appropriate to include it in this discussion.
· Present results from statistical theory learning, regarding what controls the size of training data.
· Provide an answer to the question: As training data grows, will performance continue to improve? What happens in the case of deep learning?
· We will present a methodology to determine training data size in classification.
· Finally, we will provide an answer to the question: Is the growth of training data, the best way to deal with imbalanced data?
구체적으로, 우리는 :
- 회귀 및 컴퓨터 비전 작업에 대한 경험적 학습 데이터 크기 제한을 제시합니다.
- 원하는 통계 검정의 검정력을 고려하여 표본 크기를 결정하는 방법에 대해 논의합니다. 이것은 통계에 대한 주제이지만, 머신러닝에서 학습 데이터 크기를 결정하는데 가깝기 때문에 이 논의에 포함시키는 것이 적절해 보입니다.
- 학습 데이터의 크기를 제어하는 것에 관한 통계 이론 학습 결과를 제시합니다.
- 질문에 대한 답변 제공 : 학습 데이터가 증가함에 따라 성능이 계속 향상되는 것인가? 딥러닝의 경우는 어떤가?
- 분류에서 학습 데이터 크기를 결정하는 방법을 제시합니다.
- 마지막으로, 우리는 다음 질문에 대한 답을 제공할 것입니다: 학습 데이터를 증가시키는 것이 불균형 데이터를 다루는 가장 좋은 방법인가?
Empirical Bounds for Training Data Size
Let us first discuss some widely used empirical ways to determine the size of the training data, according to the type of model we use:
· Regression Analysis: According to the 1 in 10 rule of thumb, we need 10 cases per predictor[3].
Different versions of this, such as 1 in 20 to address regression coefficient shrinkage, are discussed in [4].
One exciting, recently developed, variation for binary logistic regression is presented in [5].
Specifically, the authors estimate training data size by taking into consideration the number of predictor variables, total sample size, and the fraction of positive samples/total sample size.
· Computer Vision: For image classification using deep learning, a rule of thumb is 1,000 images per class, where this number can go down significantly if one uses pre-trained models [6].
학습 데이터 크기를 위한 경험적 경계
우리가 사용하는 모델 유형에 따라 학습 데이터의 크기를 결정하기 위해 널리 사용되는 경험적 방법에 대해 먼저 논의해 보겠습니다.
- 회귀 분석 : 1:10의 경험 규칙에 따르면 예측 변수 당 10 개의 사례가 필요합니다 [3].
다른 내용으로는, 회귀 계수 축소를 해결하기 위해 '20 개 중 하나의 규칙'이 [4]에 설명되어 있습니다.
이진 로지스틱 회귀 분석에 대한 최근 개발된 흥미로운 변형이 [5]에 제시되어 있다.
구체적으로, 저자는 예측 변수의 수, 총 샘플 크기 및 (양성 샘플의 비율/총 샘플 크기)를 고려하여 학습 데이터 크기를 추정합니다. - 컴퓨터 비전 : 딥러닝을 사용한 이미지 분류의 경우 일반적으로 class 당 1,000 개의 이미지가 있으며 사전 학습된 모델을 사용하는 경우 이 수가 크게 감소할 수 있습니다 [6].
[3] Haldan, M., How Much Training Data Do You Need?, https://medium.com/@malay.haldar/how-much-training-data-do-you-need-da8ec091e956
[4] Wikipedia, One in Ten Rule, https://en.wikipedia.org/wiki/One_in_ten_rule
[5] Van Smeden, M. et al., Sample Size For Binary Logistic Prediction Models: Beyond Events Per Variable Criteria, Statistical Methods in Medical Research, 2018.
[6] Pete Warden’s Blog, How Many Images Do You Need to Train A Neural Network?, https://petewarden.com/2017/12/14/how-many-images-do-you-need-to-train-a-neural-network/
Hypothesis Testing Sample Size Determination
Hypothesis testing is one of the tools that a data scientist can use to test the difference between populations, determine the effect of a new drug, etc.
Here it is quite often desirable to determine the sample size, given the power of the test.
Let us consider this example: A tech giant has moved to city A, and house prices there have increased dramatically.
A reporter wants to find out, what is the new average price for condos.
How many condo sale prices should he average, having a 95% confidence, given the standard deviation of condo prices at 60K and the acceptable margin of error at 10K?
The corresponding formula is shown below;
N is the sample size he will need, 1.96 is the number from the standard normal distribution corresponding to 95% confidence According to the above equation, the reporter will need to consider approximately 138 condo prices.
The above formula changes according to the specific test, but it will always include the confidence interval, the accepted margin of error and a measure of standard deviation. A good discussion on the topic can be found in [7].
가설 테스트 샘플 크기 결정
가설 테스트는 data scientist가 모집단 간의 차이를 테스트하고 새로운 샘플의 효과를 결정하는 데 사용할 수 있는 방법 중 하나입니다.
여기서 테스트의 힘을 고려하여 샘플 크기를 결정하는 것이 종종 바람직합니다.
이 예를 고려해 봅시다. 한 거대 테크 기업이 A 도시로 이사했고 그곳의 주택 가격이 크게 상승했습니다.
기자는 그곳의 새로운 평균 가격이 얼마인지 알고 싶어 합니다.
콘도 가격의 표준 편차가 60K이고 허용 가능한 오차 한계가 10K인 경우 95% 신뢰도를 보인 평균 콘도 판매 가격은 얼마일까요?
해당 공식은 다음과 같습니다.
N은 필요로 하는 표본 크기이고, 1.96은 95% 신뢰도에 해당하는 표준 정규 분포의 수입니다. 위의 방정식에 따르면, 기자는 대략 138개의 주택 가격을 고려해야 합니다.
위의 공식은 특정 테스트에 따라 변경되지만 항상 신뢰 구간, 허용 오차 한계 및 표준 편차 측정값이 포함됩니다. 이 주제에 대한 좋은 토론은 [7]에서 찾을 수 있습니다.
[7] Sullivan, L., Power and Sample Size Distribution, http://sphweb.bumc.bu.edu/otlt/MPH-Modules/BS/BS704_Power/BS704_Power_print.html
Statistical Learning Theory for Training Data Size
Let us first introduce the famous Vapnik-Chevronenkis (VC) dimension [8].
The VC dimension is a measure of the complexity of a model; the more complex the model, the higher its VC dimension.
In the next paragraph, we will introduce a formula that specifies training data size, in terms of VC.
First, let us see an example often used to show how VC is calculated:
Imagine our classifier is a straight line in a 2-D plane and we have 3 points that need to be classified.
Whatever the combination of positive/negative of these 3 points might be (all positive, 2 positive, 1 positive, etc.), a straight line can correctly classify/separate positive from negative samples.
So, we say a linear classifier can shatter any points, and, therefore, its VC dimension is at least 3.
And because we can find examples of 4 points that can NOT be accurately separated by a line, we say that VC of the linear classifier is precisely 3.
It turns out that the training data size, N, is a function of VC [8]:
where d is the probability of failure and epsilon is the learning error.
Therefore, as noted in [9], the amount of data needed for learning depends on the complexity of the model.
A side effect of this is the well-known voracity of neural networks for training data, given their significant complexity.
학습 데이터 크기에 대한 통계 학습 이론
먼저 유명한 Vapnik-Chevronenkis (VC) 차원을 소개하겠습니다 [8].
VC 차원은 모델의 복잡성을 측정한 것입니다. 모델이 복잡할수록 VC 차원이 높아집니다.
다음 단락에서는 VC 측면에서 학습 데이터 크기를 지정하는 공식을 소개합니다.
먼저 VC 계산 방법을 보여주기 위해 자주 사용되는 예를 살펴보겠습니다.
우리의 분류기가 2차원 평면에서 직선이고 우리가 분류해야 할 3개의 점이 있다고 상상해보십시오.
이 3가지 점의 긍정/부정의 조합이 무엇이든 (모두 긍정, 2개의 긍정, 1개의 긍정 등), 직선은 부정의 샘플에서 긍정을 정확하게 분류/분리할 수 있습니다.
따라서 선형 분류기는 점을 산산조각 낼 수 있으므로 VC 차원은 적어도 3 이상입니다.
그리고 4개의 점은 선으로 정확하게 분리할 수 없는 것에 대한 예시를 찾을 수 있기 때문에 선형 분류기의 VC 차원은 정확히 3이라고 합니다.
학습 데이터 크기 N은 VC의 함수임이 밝혀졌습니다. [8] :
Estimation of training data size from the VC dimension
여기서 d는 실패 확률이고 epsilon은 학습 오류입니다.
따라서 [9]에서 언급 한 바와 같이 학습에 필요한 데이터의 양은 모델의 복잡성에 따라 달라집니다.
학습 데이터에 대한 잘 알려진 신경망의 다양성의 부작용은 상당히 복잡하다는 것입니다.
[8] Wikipedia, Vapnik-Chevronenkis Dimension, https://en.wikipedia.org/wiki/Vapnik%E2%80%93Chervonenkis_dimension
[9] Juba, B. and H. S. Le, Precision-Recall Versus Accuracy and the Role of Large Data Sets, Association for the Advancement of Artificial Intelligence, 2018.
As Training Data Grows, Will Performance Continue to Improve Accordingly? What Happens in the Case of Deep Learning?
Figure 1 shows how the performance of machine learning algorithms changes with increasing data size in the case of traditional machine learning [10] algorithms (regression, etc.) and in the case of deep learning [11].
Specifically, for traditional machine learning algorithms, performance grows according to a power law and then reaches a plateau.
Regarding deep learning, there is significant ongoing research as to how performance scales with increasing data size [12]-[16], [18].
Figure 1 shows the current consensus for much of this research; for deep learning, performance keeps increasing with data size according to a power law.
For example, in [13], the authors used deep learning techniques for classification of 300 million images, and they found that performance increased logarithmically with increasing training data size.
Let us include here some noteworthy, contradictory to the above, results in the field of deep learning.
Specifically, in [15] the authors used convolutional networks for a dataset of 100 million Flickr images and captions.
Regarding training data size, they report that performance increases with growing data size; however, it plateaus after 50 million images.
In [16], the authors found that image classification accuracy increases with training data size; however, model robustness, which also increased initially, after a certain model-dependent point, started to decline.
학습 데이터가 증가함에 따라 성능이 계속 향상됩니까? 딥러닝의 경우 어떻게 됩니까?
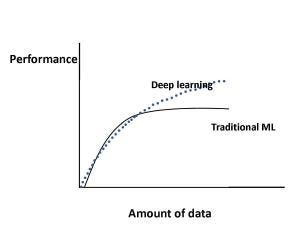
그림 1은 전통적인 머신러닝 알고리즘 (회귀 등)의 경우와 딥러닝의 경우에 데이터 크기가 증가함에 따라 머신러닝 알고리즘의 성능이 어떻게 변하는지 보여줍니다 [11].
특히, 전통적인 머신러닝 알고리즘의 경우, 거듭제곱의 법칙에 따라 성능이 향상되어 안정에 도달합니다.
딥러닝과 관련하여 데이터 크기가 증가함에 따라 성능이 어떻게 확장되는지에 대한 연구가 계속 진행되고 있습니다 [12]-[16], [18].
그림 1은 이 연구의 많은 부분에 대한 현재 컨센서스를 보여줍니다. 딥러닝의 경우 거듭제곱의 법칙에 따라 데이터 크기에 따라 성능이 계속 향상됩니다.
예를 들어, [13]에서 저자는 3억 개의 이미지를 분류하기 위해 딥러닝 기술을 사용했으며 학습 데이터 크기가 증가함에 따라 성능이 로그적으로 향상됨을 발견했습니다.
위의 내용과 모순되는 주목할만한 몇 가지 결과를 딥러닝 분야에 포함시켜 보겠습니다.
구체적으로, [15]에서 저자는 1억 개의 Flickr 이미지와 캡션 데이터 세트에 컨볼루션 네트워크를 사용했습니다.
학습 데이터 크기와 관련하여 데이터 크기가 커질수록 성능이 향상된다고 보고합니다. 그러나 5천만 장의 이미지 이후에는 정체 상태입니다.
[16]에서 저자들은 학습 데이터 크기에 따라 이미지 분류 정확도가 증가한다는 것을 발견했습니다. 그러나 초기에 증가한 모델 견고성은 특정 모델-의존적 지점 이후에 감소하기 시작했습니다.
[11] Shchutskaya, V., Latest Trends on Computer Vision Market, https://indatalabs.com/blog/data-science/trends-computer-vision-software-market?cli_action=1555888112.716
[12] De Berker, A., Predicting the Performance of Deep Learning Models, https://medium.com/@archydeberker/predicting-the-performance-of-deep-learning-models-9cb50cf0b62a
[13] Sun, C. et al., Revisiting Unreasonable Effectiveness of Data in Deep Learning Era, https://arxiv.org/abs/1707.02968, Aug. 2017.
[14] Hestness, J., Deep Learning Scaling is Predictable, Empirically, https://arxiv.org/pdf/1712.00409.pdf
[15] Joulin, A., Learning Visual Features from Large Weakly Supervised Data, https://arxiv.org/abs/1511.02251, November 2015.
[16] Lei, S. et al., How Training Data Affect the Accuracy and Robustness of Neural Networks for Image Classification, ICLR Conference, 2019.
[17] Tutorial: Learning Curves for Machine Learning in Python, https://www.dataquest.io/blog/learning-curves-machine-learning/
[18] Ng, R., Learning Curve, https://www.ritchieng.com/machinelearning-learning-curve/
A Methodology to Determine Training Data Size in Classification
This is based on the well-known learning curve, which in general is a plot of error versus training data size.
[17] and [18] are excellent references to learn more about learning curves in machine learning, and how they change with increasing bias or variance.
Python offers a learning curve function in scikit-learn [17].
In classification, we typically use a slightly different form of the learning curve; it is a plot of classification accuracy versus training data size.
The methodology for determining training data size is straightforward:
Determine the exact form of the learning curve for your domain, and then, simply find the corresponding point on the plot for your desired classification accuracy.
For example, in references [19],[20], the authors use the learning curve approach in the medical domain and they represent it with a power law function:
Learning curve equation
where y is the classification accuracy, x is the training set, and b1,b2 correspond to the learning rate and decay rate.
The parameters change according to the problem domain, and they can be estimated using nonlinear regression or weighted nonlinear regression.
분류에서 학습 데이터 크기를 결정하는 방법론
이것은 잘 알려진 학습 곡선을 기반으로 하며 일반적으로 오류 vs 학습 데이터 크기의 도표입니다.
[17]과 [18]은 머신 러닝의 학습 곡선에 대한 자세한 내용과 바이어스 또는 분산이 증가함에 따라 곡선이 어떻게 변하는지에 대한 훌륭한 참고 자료입니다.
파이썬은 scikit-learn [17]에서 학습 곡선 함수를 제공합니다.
분류에서는 일반적으로 약간 다른 형태의 학습 곡선을 사용합니다. 분류 정확도 vs 학습 데이터 크기의 도표입니다.
학습 데이터 크기를 결정하는 방법은 간단합니다.
도메인에 대한 학습 곡선의 정확한 형태를 결정한 다음 원하는 분류 정확도에 대한 도표에서 해당 지점을 찾으십시오.
예를 들어, 참고 문헌 [19], [20]에서 저자는 의료 영역에서 학습 곡선 접근법을 사용하고 이를 거듭제곱의 법칙 함수로 표현합니다:
여기서 y는 분류 정확도이고, x는 학습 세트이며, b1, b2는 학습 속도 및 경감 속도에 해당합니다.
모수는 문제 영역에 따라 변경되며 비선형 회귀 또는 가중 비선형 회귀를 사용하여 추정할 수 있습니다.
[17] Tutorial: Learning Curves for Machine Learning in Python, https://www.dataquest.io/blog/learning-curves-machine-learning/
[18] Ng, R., Learning Curve, https://www.ritchieng.com/machinelearning-learning-curve/
[19]Figueroa, R. L., et al., Predicting Sample Size Required for Classification Performance, BMC medical informatics and decision making, 12(1):8, 2012.
[20] Cho, J. et al., How Much Data Is Needed to Train A Medical Image Deep Learning System to Achieve Necessary High Accuracy?, https://arxiv.org/abs/1511.06348, January 2016.
Is Growth of Training Data, The Best Way to Deal With Imbalanced Data?
This question is addressed in [9].
The authors raise an interesting point; in the case of imbalanced data, accuracy is not the best measure of the performance of a classifier.
The reason is intuitive: Let us assume that the negative class is the dominant one. Then we can achieve high accuracy, by predicting negative most of the time.
Instead, they propose precision and recall (also known as sensitivity) as the most appropriate measure of the performance for imbalanced data.
In addition to the apparent problem of accuracy described above, the authors claim that measuring precision is inherently more important for imbalanced domains.
For example, in a hospital alarm system [9], high precision means that when an alarm sounds, it is highly likely that there is indeed a problem with a patient.
Armed with the appropriate performance measure, the authors compared the imbalance correction techniques in package imbalanced-learn[21] (Python scikit-learn library) with simply using a larger training data set.
Specifically, they used K-Nearest neighbor with imbalance-correction techniques on a drug discovery-related dataset of 50,000 examples and then compared with K-NN on the original dataset of approximately 1 million examples.
The imbalance-correcting techniques in the above package include under-sampling, over-sampling and ensemble learning. The authors repeated the experiment 200 times.
Their conclusion is simple and profound: No imbalance-correcting technique can match adding more training data when it comes to measuring precision and recall.
And with this, we have reached the end of our quick tour.
The references below can help you learn more about the subject. Thank you for reading!
불균형 데이터를 처리하는 가장 좋은 방법은 학습 데이터를 키우는 것입니까?
이 질문은 [9]에서 다룹니다. 저자들은 흥미로운 점을 제기합니다. 불균형 데이터의 경우 정확도는 분류기 성능의 가장 좋은 척도가 아닙니다.
그 이유는 직관적입니다. 음성 클래스가 지배적이라고 가정해 봅시다. 그런 다음 대부분을 음성으로 예측하여 높은 정확도를 달성할 수 있습니다.
대신, 이들은 불균형 데이터의 성능을 측정하는 가장 적절한 척도로 precision(정밀도)과 recall(재현율)(sensitivity 라고도 함)을 제안합니다. 위에서 설명한 정확도의 명백한 문제 외에도, 저자는 불균형 영역에서 precision(정밀도) 측정이 본질적으로 더 중요하다고 주장합니다.
예를 들어, 병원 경보 시스템 [9]에서 높은 precision(정밀도)는 경보 음이 울릴 때 실제로 환자에게 문제가 있을 가능성이 높다는 것을 의미합니다.
적절한 성능 측정으로 무장한 저자는 불균형 학습 패키지 [21] (Python scikit-learn 라이브러리)의 불균형 보정 기술을 단순히 더 큰 학습 데이터 세트를 사용하여 비교했습니다.
구체적으로, 그들은 약 50,000 개의 예의 약물 발견 관련 데이터 세트에서 불균형 보정 기술을 가진 K-Nearest 이웃을 사용하고 나서 약 1백만 개의 예의 원래 데이터 세트에서 K-NN과 비교했습니다.
위 패키지의 불균형 수정 기술에는 언더 샘플링, 오버 샘플링 및 앙상블 학습이 포함됩니다. 저자는 실험을 200 회 반복했습니다. 그들의 결론은 간단하고 심오합니다. : precision(정밀도)와 recall(재현율) 측정에 있어 더 많은 학습 데이터를 추가하는 것과 비교할 수 있는 불균형 교정 기술은 없다.
그리고 이것으로 우리는 빠른 여행의 끝에 도달했습니다. 아래의 참고 문헌은 해당 주제에 대한 자세한 정보를 제공합니다. 읽어 주셔서 감사합니다!
[9] Juba, B. and H. S. Le, Precision-Recall Versus Accuracy and the Role of Large Data Sets, Association for the Advancement of Artificial Intelligence, 2018.
[21] Lemaitre, G., F. Nogueira, and C. K. Aridas, Imbalanced-learn: A Python Toolbox to Tackle the Curse of Imbalanced Datasets in Machine Learning, https://arxiv.org/abs/1609.06570