Feature Selection 개요
모델을 구성하는 주요 Feature 선택
- 불필요한 다수의 피처들로 인해 모델 성능을 떨어뜨릴 가능성 제거
- 이해할 수 있는 설명 가능한 모델이 될 수 있도록 피처들을 선별
Feature Selection 유형
- Feature값의 분포, NULL, Feature간 높은 상관도, 결정(Target)값과 독립성 고려
- 모델의 Feature Importance 기반 (GINI 계수, 회귀 계수, ...)
scikit-learn의 Feature Selection 관련 기능
1. RFE (Recursive Feature Elimination)
- 모델 최초 학습 후 Feature 중요도 선정
- 단, 수행 시간이 오래 걸리고, 낮은 속성을 제거해나가는 메커니즘이 정확한 Feature Selection을 찾는 목표에 정확히 부합하지 않을 수 있음
- SelectionFromModel
- 모델 최초 학습 후 선정된 Feature 중요도에 따라 평균/중앙값의 특정 비율 이상인 Feature들 선택
- 손으로도 금방 짤 수 있음
- Permutation Importance
- 특정 Feature들이 값을 완전히 변조했을 때 모델 성능이 얼마나 저하되는지를 기준으로 해당 Feature의 중요도를 산정
- 학습 데이터를 제거하거나/변조하면 다시 재학습을 수행해야 하므로 수행 시간이 오래 걸림
- 그니까 모델 학습 후 테스트 데이터(검증데이터)에 특정 피처들을 반복적으로 변조한 뒤 해당 Feature의 중요도를 평균적으로 산정
Feature Selection 실습
RFE
Recursive Feature Elimination
중요도가 낮은 Feature를 차례대로 제거함
make_classification임의로 분류 데이터 샘플링
step=11개씩 제거하면서 진행 (25, 24, 23, ...)
verbose=2순차적으로 함축 정보 출력
import matplotlib.pyplot as plt
from sklearn.svm import SVC
from sklearn.model_selection import StratifiedKFold
from sklearn.feature_selection import RFECV, RFE
from sklearn.datasets import make_classification


X, y = make_classification(n_samples=1000, n_features=25, n_informative=3,
                           n_redundant=2, n_repeated=0, n_classes=8,
                           n_clusters_per_class=1, random_state=0)

# SVC classifier 선택
svc = SVC(kernel="linear")
# REFCV로 Feature들을 반복적으로 제거해가면서 학습/평가 수행
rfecv = RFECV(estimator=svc, step=1, cv=StratifiedKFold(2),
              scoring='accuracy', verbose=2)
rfecv.fit(X, y)

print("Optimal number of features : %d" % rfecv.n_features_)

# Plot number of features VS. cross-validation scores
plt.figure()
plt.xlabel("Number of features selected")
plt.ylabel("Cross validation score (nb of correct classifications)")
plt.plot(range(1, len(rfecv.grid_scores_) + 1), rfecv.grid_scores_)
plt.show()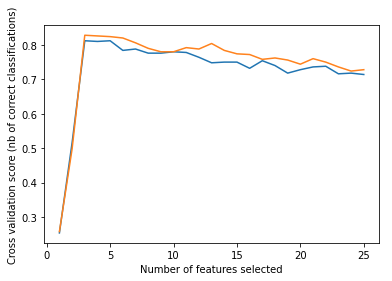
Feature가 3개쯤일 때 스코어가 높음
-> 굉장히 이상적인 Feature Selection
단, 실제로는 이런 경우 흔치 않음
SelectFromModel
회귀 계수의 절댓값을 중요도로 판단하고 시각화해보자
당뇨병 데이터에 대해 Lasso를 적용했다.
from sklearn.datasets import load_diabetes
import matplotlib.pyplot as plt
import numpy as np
from sklearn.linear_model import LassoCV


diabetes = load_diabetes()
X, y = diabetes.data, diabetes.target

lasso = LassoCV().fit(X, y)
importance = np.abs(lasso.coef_)
feature_names = np.array(diabetes.feature_names)
plt.bar(height=importance, x=feature_names)
plt.title("Feature importances via coefficients")
plt.show()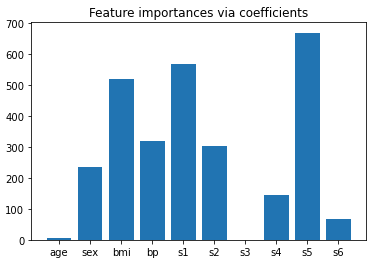
첫 번째로 bmi 보다 큰 변수들만 뽑아보자
sort 시킨 후 threshold를 3번째로 큰 bmi의 회귀 계수의 절댓값보다 0.01 크게 한다.
from sklearn.feature_selection import SelectFromModel
from time import time

threshold = np.sort(importance)[-3] + 0.01
print('threshold:', threshold)

sfm = SelectFromModel(lasso, threshold=threshold).fit(X, y)
print("Features selected by SelectFromModel: "
      f"{feature_names[sfm.get_support()]}")
threshold: 521.754369295439
Features selected by SelectFromModel: ['s1' 's5']이번에는 을 threshold로 지정하자
from sklearn.feature_selection import SelectFromModel
from time import time

# threshold = np.sort(importance)[-3] + 0.01
# print('threshold:', threshold)

sfm = SelectFromModel(lasso, threshold='1.5 * median').fit(X, y)

print("Features selected by SelectFromModel: "
      f"{feature_names[sfm.get_support()]}")
Features selected by SelectFromModel: ['bmi' 's1' 's5']총 3가지 Feature가 선택됨
Permutation Importance
검증/평가 데이터에 멀쩡히 있는 Feature를 조작해서 성능이 얼마나 떨어지나 확인 후,
조작 후 성능이 많이 떨어지는 Feature의 중요도가 높다고 판단하는 것임
from sklearn.datasets import load_diabetes
from sklearn.model_selection import train_test_split
from sklearn.linear_model import Ridge
from sklearn.metrics import r2_score

diabetes = load_diabetes()
X_train, X_val, y_train, y_val = train_test_split(diabetes.data, diabetes.target, random_state=0)

#학습, 예측, R2 Score 평가
model = Ridge(alpha=1e-2).fit(X_train, y_train)
y_pred = model.predict(X_val)
print('r2 score:', r2_score(y_val, y_pred))
r2 score: 0.3566675322939423기본적인 R2 score가 이정도 나왔다.
Permutation Importance를 적용함
- 가장 평균 permutation importance가 높은 순으로 내림차순 정렬
- 평균 permutation importance값과 표준 편차 출력
- 표준편차 관련 조건은 평균이 높더라도 표준편차가 너무 큰 값은 제외하려고 넣은 것
from sklearn.inspection import permutation_importance

r = permutation_importance(model, X_val, y_val, n_repeats=30, random_state=0)

for i in r.importances_mean.argsort()[::-1]:
    if r.importances_mean[i] - 2 * r.importances_std[i] > 0:
         print(diabetes.feature_names[i],"   ", np.round(r.importances_mean[i], 4), " +/- ", np.round(r.importances_std[i], 5))
s5 0.2042 +/- 0.04964
bmi 0.1758 +/- 0.0484
bp 0.0884 +/- 0.03284
sex 0.0559 +/- 0.02319s5의 importance_mean이 0.2042인데 이것의 의미가
원래 R2 Score: 0.3567에서 약 0.2042만큼 감소해서 R2 Score가 약 0.15가 된다는 뜻임
Feature를 조작했을 때 R2 Score가 큰 폭으로 떨어지니까 중요한 Feature라는 뜻!
Feature Importance에 대해서
왜 Feature Importance는 절대적인 Feature Selection 기준이 될 수 없는가?
- Feature Importance는 최적 tree 구조를 만들기 위한 impurity(불순도)가 중요 기준임. 결정 값과 관련이 없어도 Feature importance가 높아질 수 있음
- Feature Importance는 학습 데이터를 기반으로 생성됨, 테스트 데이터에서는 달라질 수 있음
- Feature Importance는 number 형의 높은 cardinality feature에 biased 되어 있음
관련 코드는 완강 후 다시 보자