연구자들에게 있어 최신 연구 동향을 파악하는 것은 중요한 일이다.
인기있는 분야의 주제는 지속적으로 바뀌어왔으며, 단편적인 논문의 양만으로는 최신 트렌드를 따라가기에 쉽지 않다.
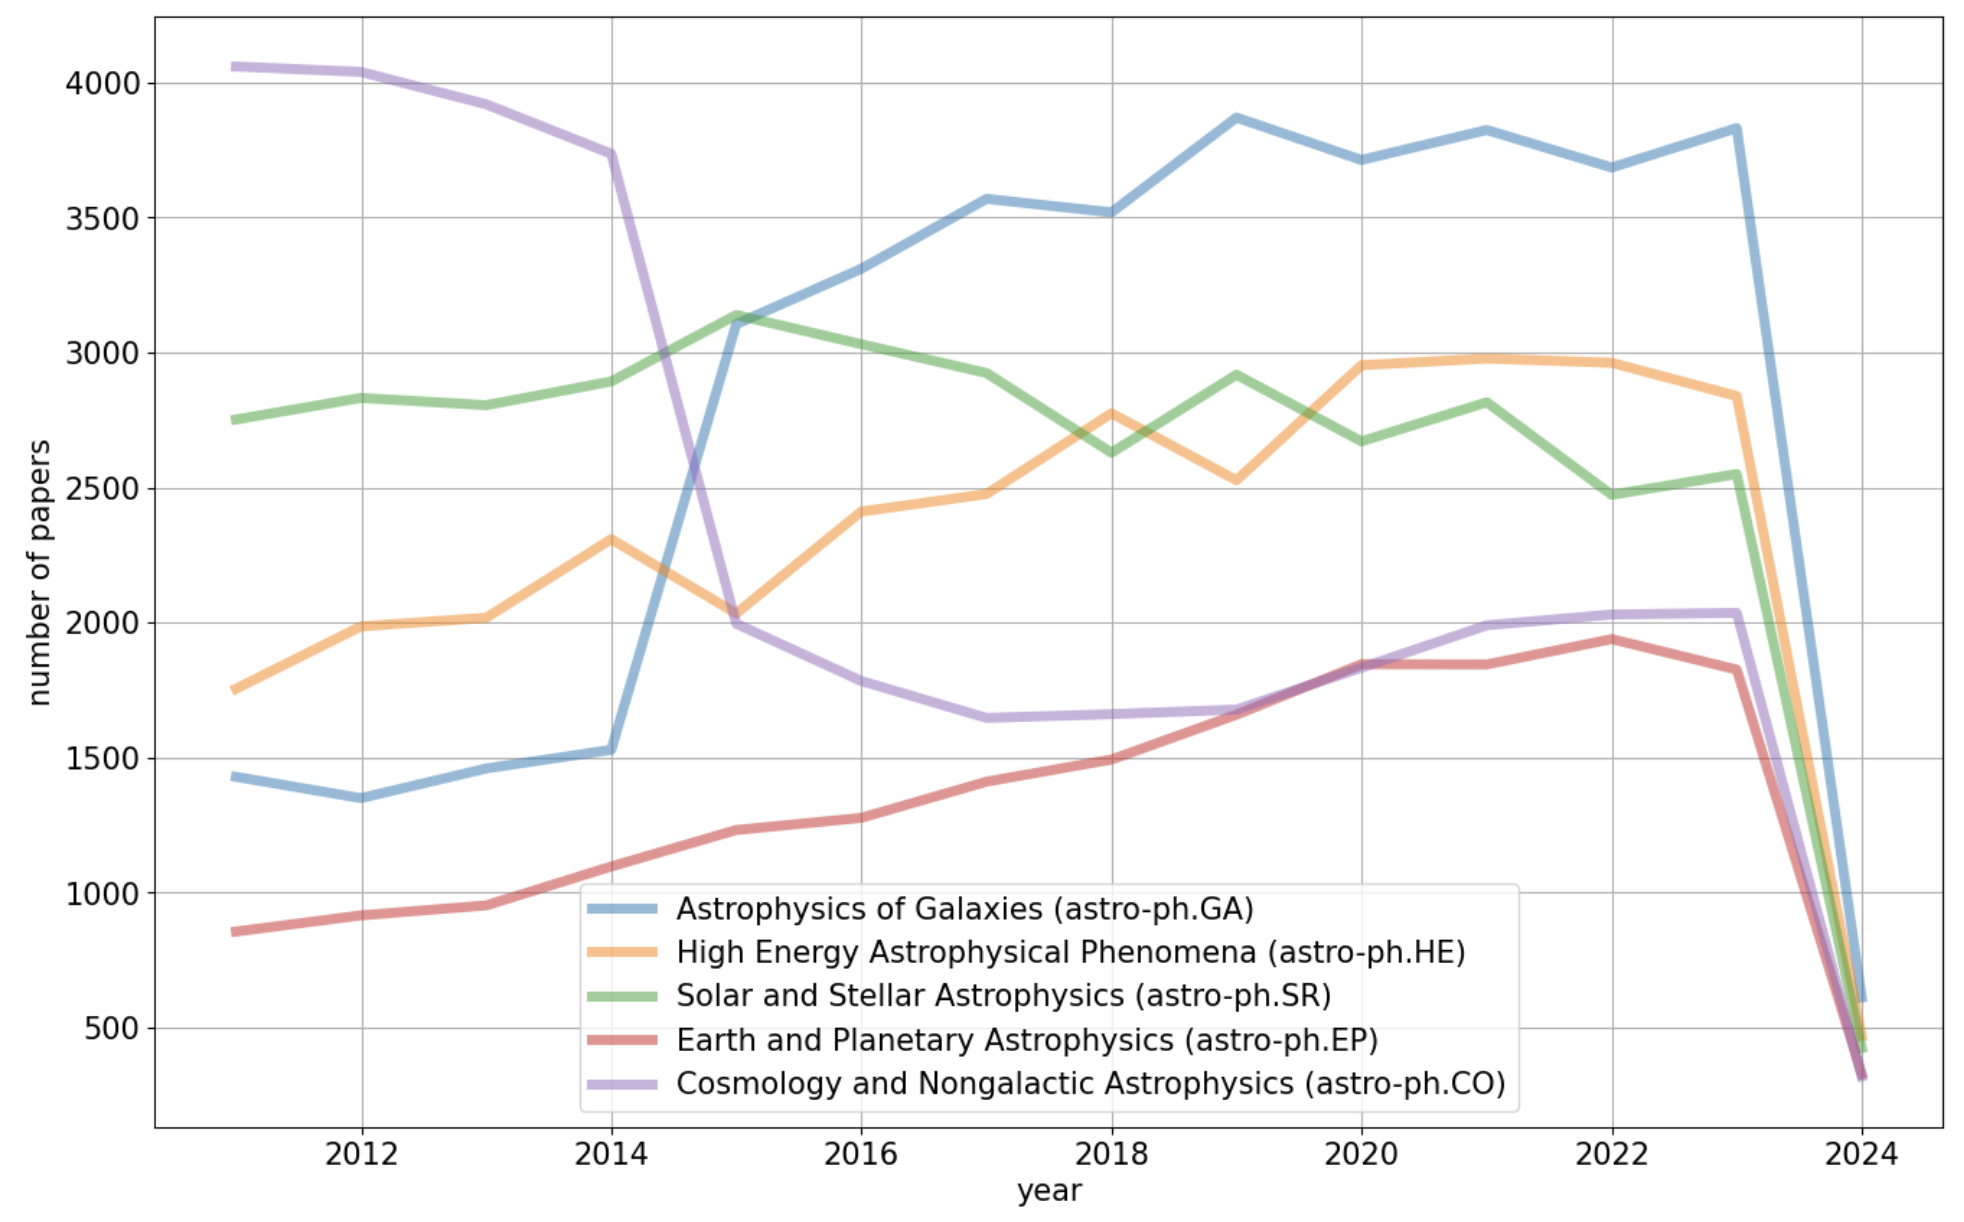
따라서 천문학 분야에서, 최근 10년간 연구 동향이 어떻게 바뀌어왔나를 파악할 수 있는 데이터 분석을 진행했다.
많은 데이터 수집을 위해 많은 연구자들이 자신의 논문을 올리는 arxiv.org를 사용하였으며, 2010년부터 2023년까지 연단위의 논문 갯수를 분석하였다.
from bs4 import BeautifulSoup
from urllib.request import urlopen
import requests
subjects = {}
year_month = []
for yr in range(10,24):
    for mn in range(1,13):
        if mn < 10:
            year_month.append(str(yr)+'0'+str(mn))
        else:
            year_month.append(str(yr)+str(mn))
        if year_month[-1] == '2302':
            break

for ym in year_month:
    response = requests.get('https://arxiv.org/list/astro-ph/'+ym+'?show=5000').text
    soup = BeautifulSoup(response, 'html.parser')
    subjects[ym] = [i.text for i in soup.find_all('span', class_='primary-subject')]

import pandas as pd
df_subjects = pd.DataFrame.from_dict(subjects, orient='index').transpose()

# for ym in year_month:
tmp_top10 = df_subjects['2302'].value_counts().head(5).index.values
top10 = {}
for k in tmp_top10:
    top10[k] = []
for ym in year_month:
    series = df_subjects[ym].value_counts()
    for k in tmp_top10:
        top10[k].append(series[k])

import datetime as dt
dt_year_month = []
for ym in year_month:
    year = 2000+int(ym[:2])
    month = int(ym[2:])
    dt_year_month.append(dt.datetime(year, month, 1))
df_top10 = pd.DataFrame(top10, index=dt_year_month)
df_top10 = df_top10.resample('1Y', axis=0).sum()

import matplotlib.pyplot as plt
import numpy as np
plt.rc('font', size=15)
plt.figure(figsize=(16,10))
for k in tmp_top10:
    plt.plot(df_top10.index, df_top10[k], label=k, lw=5, alpha=.5)
plt.legend()
plt.grid()
plt.show()