1. Streamlit이란?
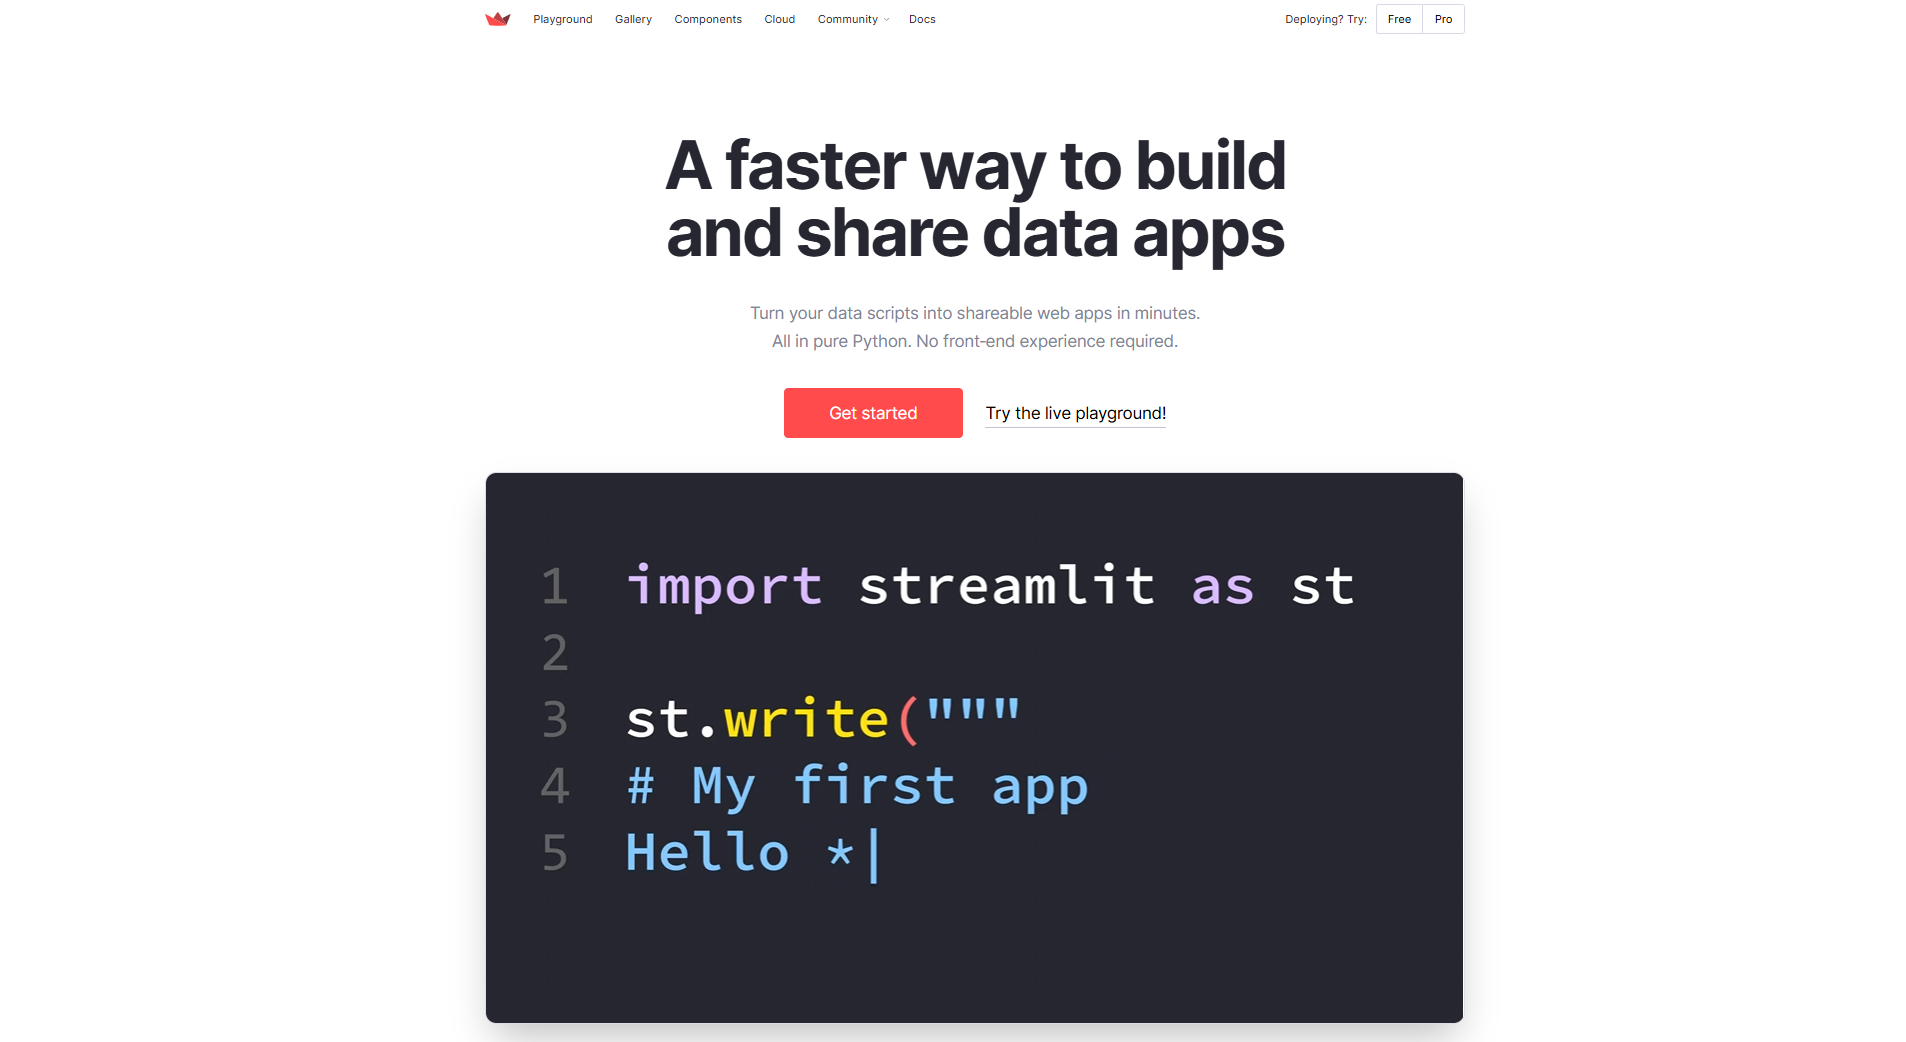
Streamlit은 Python 기반의 오픈소스 웹 애플리케이션 프레임워크로, 데이터 사이언스 및 머신러닝 모델을 빠르게 배포하고 공유할 수 있도록 설계된 도구입니다.
- Flask, Django 같은 전통적인 웹 프레임워크보다 훨씬 간결한 코드로 대시보드를 구축할 수 있습니다.
- 머신러닝 모델의 입력과 출력을 쉽게 시각화하고, 웹 인터페이스를 손쉽게 만들 수 있습니다.
📺 공식 소개 영상: Streamlit Crash Course

2. Streamlit의 주요 특징
-
간편한 구현:
- 몇 줄의 Python 코드만으로 웹 애플리케이션을 만들 수 있음.
-
백엔드 개발 불필요:
- 별도의 API 서버 구축 없이 Python 코드만으로 대시보드 구현 가능.
-
자동 리렌더링:
- UI 요소가 변경되면 자동으로 애플리케이션이 업데이트됨.
-
배포 기능 지원:
- Streamlit Cloud를 이용해 쉽게 배포 가능.
-
인터랙티브 UI 제공:
- 사용자가 입력한 데이터를 즉시 반영할 수 있는 위젯(버튼, 슬라이더, 체크박스 등) 지원.
-
다양한 차트 및 지도 지원:
- 데이터를 시각적으로 표현할 수 있는 다양한 차트 및 지도 위젯을 기본 제공.
-
커뮤니티 및 확장 기능 지원:
- 다양한 플러그인과 사용자 정의 컴포넌트를 활용하여 기능 확장이 가능.
3. Streamlit 설치 및 기본 실행
📌 3.1 설치
pip install streamlit- 설치 완료 후 기본 데모 실행:
streamlit hello- 위 명령어를 실행하면 기본 데모가 브라우저(http://localhost:8501/) 에서 열립니다.
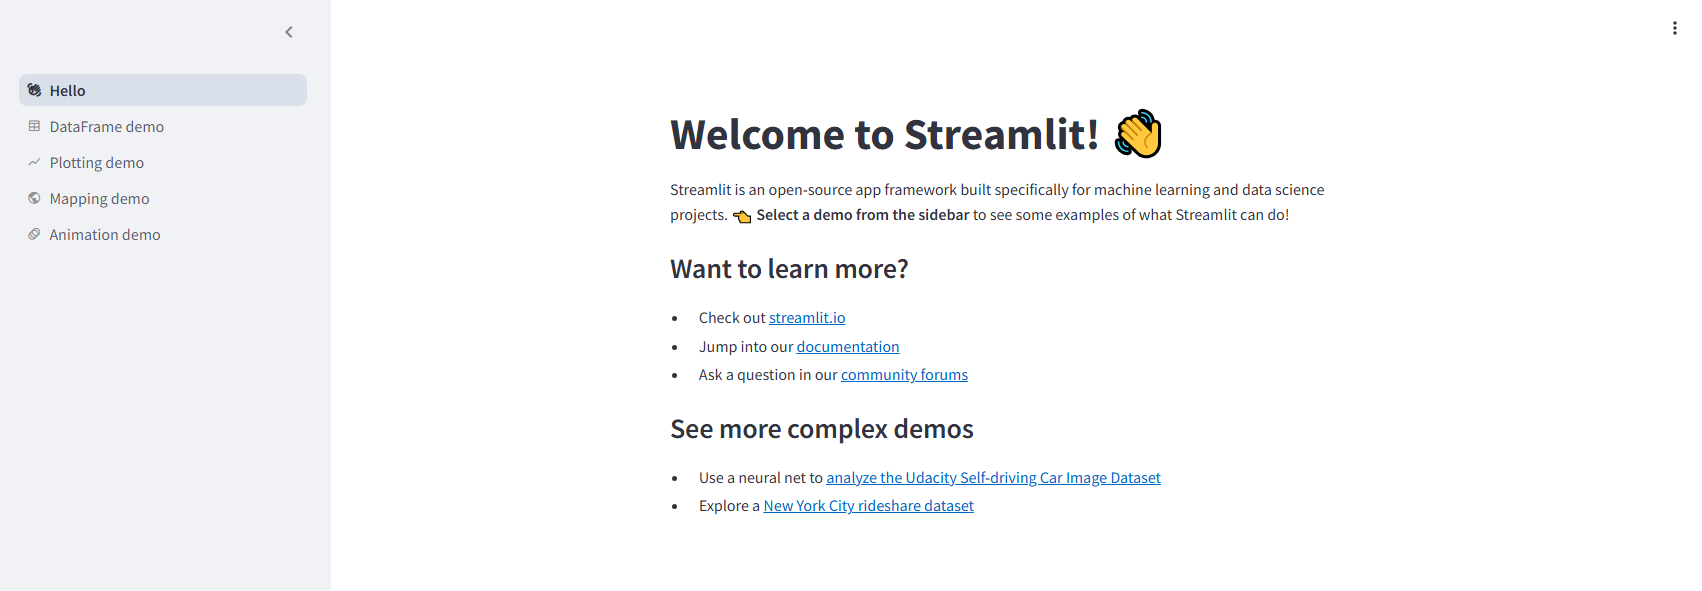
해당 demo에는 샘플 대시보드 및 구현 샘플 코드 snippet이 존재합니다.
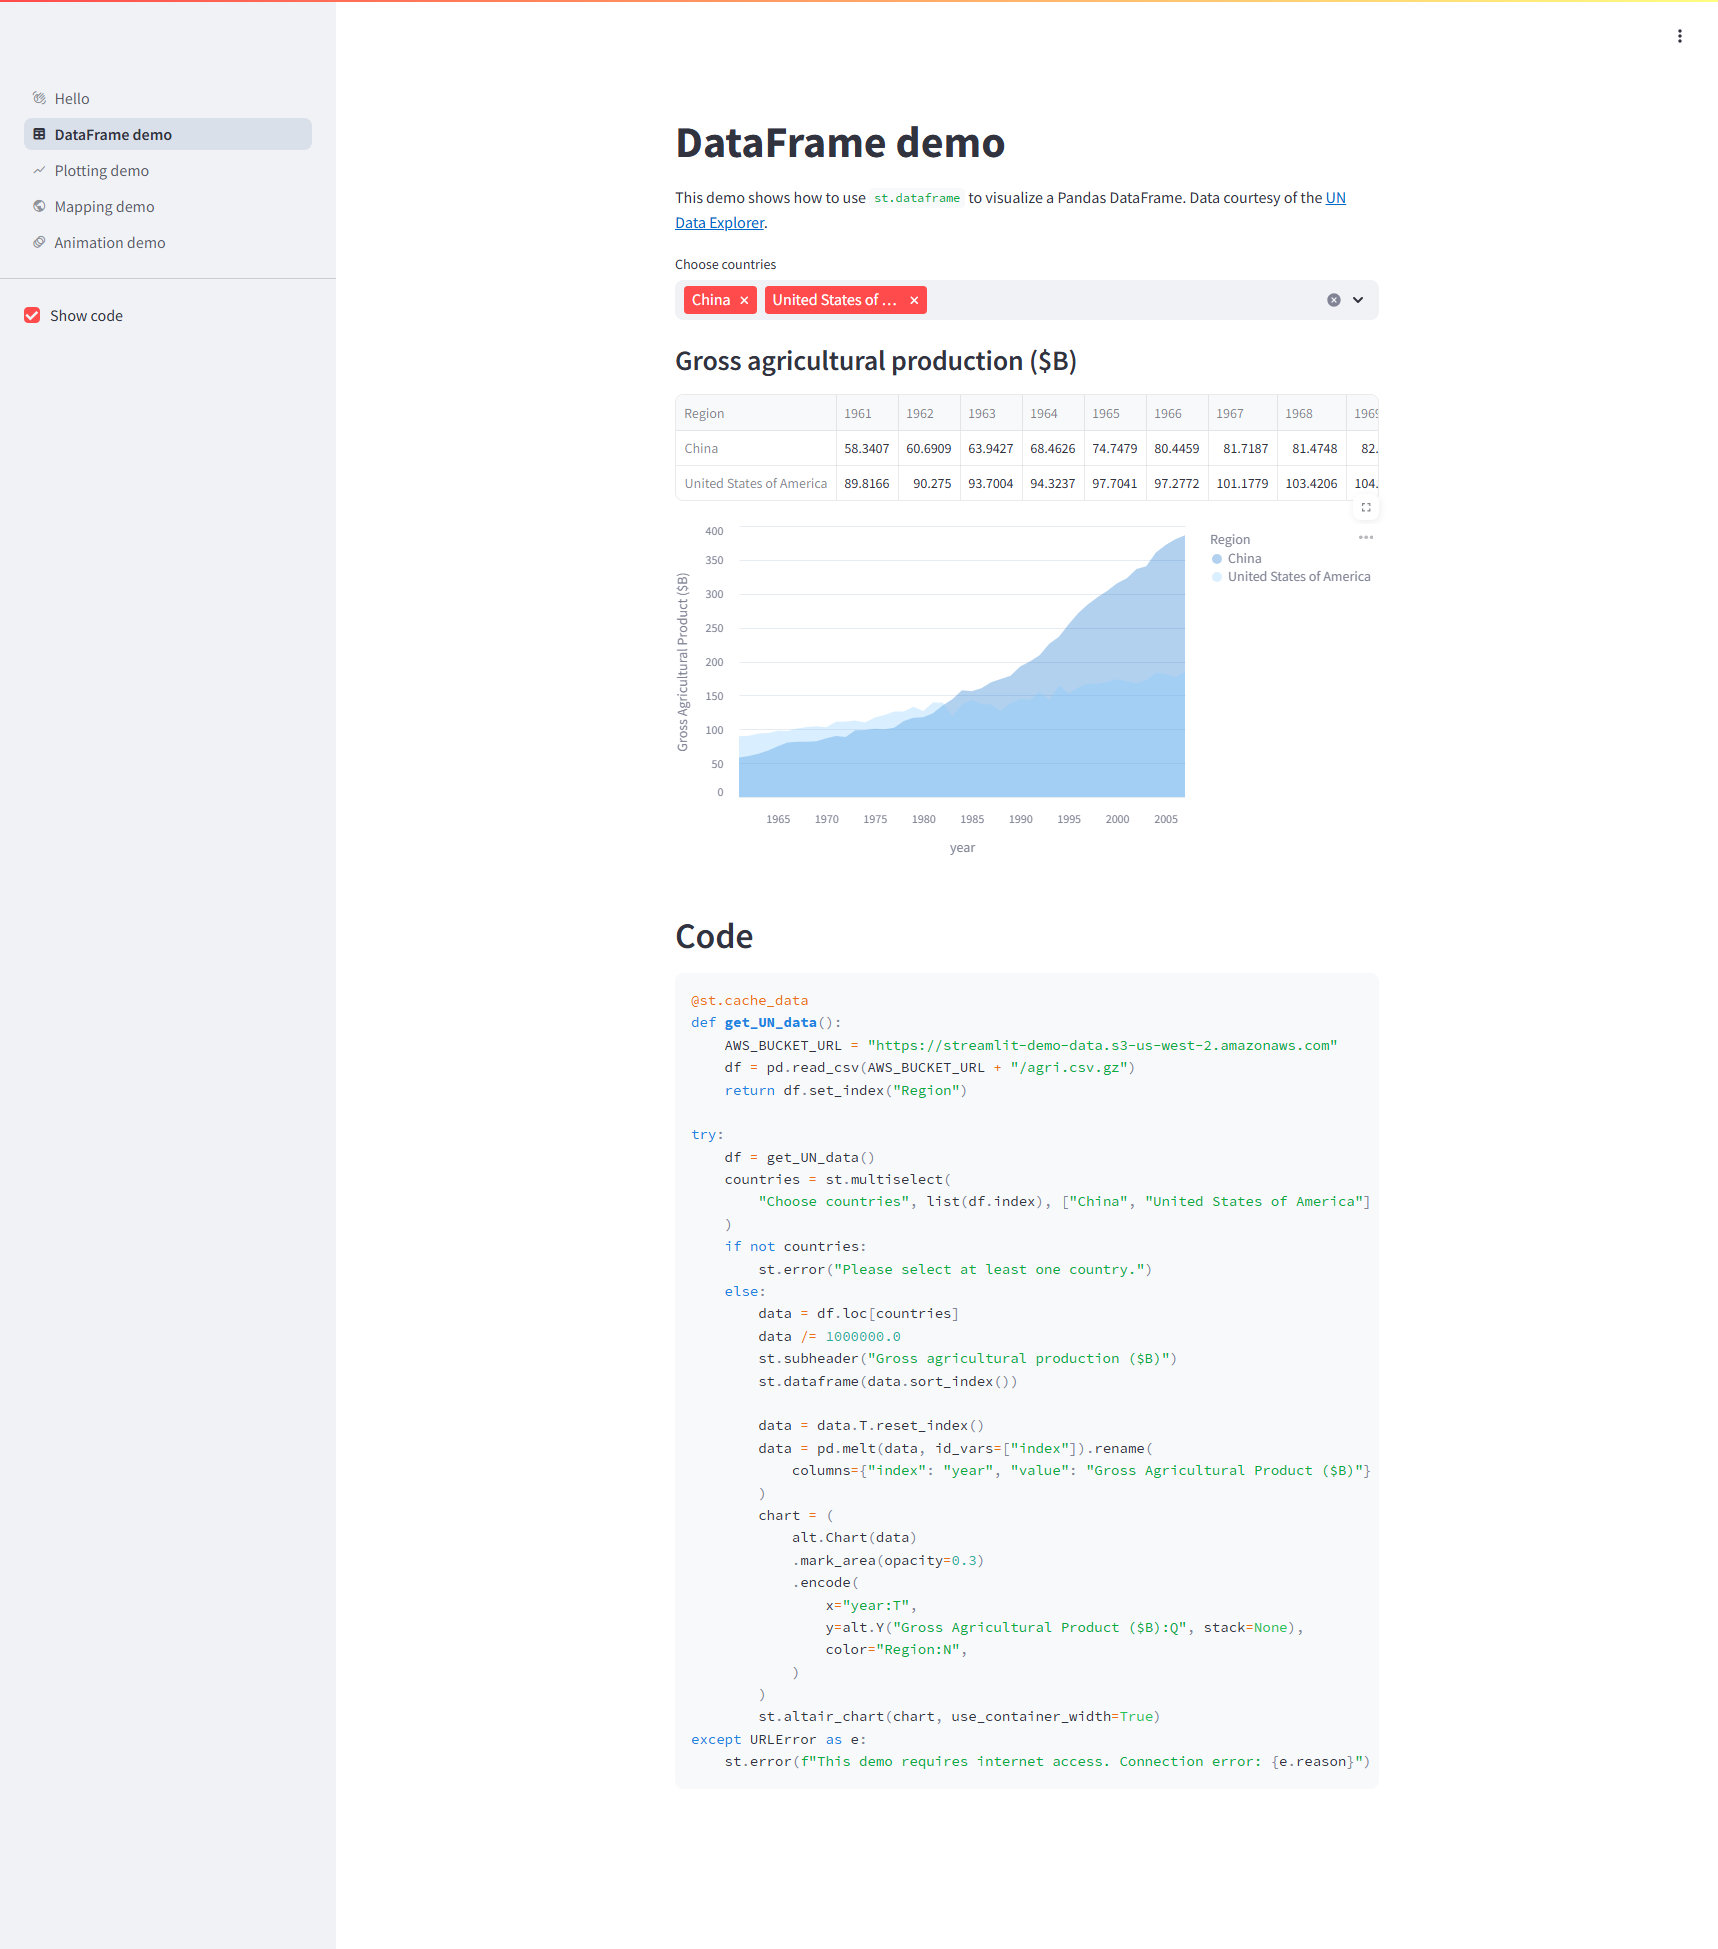
- DataFrame demo
@st.cache_data
def get_UN_data():
    AWS_BUCKET_URL = "https://streamlit-demo-data.s3-us-west-2.amazonaws.com"
    df = pd.read_csv(AWS_BUCKET_URL + "/agri.csv.gz")
    return df.set_index("Region")

try:
    df = get_UN_data()
    countries = st.multiselect(
        "Choose countries", list(df.index), ["China", "United States of America"]
    )
    if not countries:
        st.error("Please select at least one country.")
    else:
        data = df.loc[countries]
        data /= 1000000.0
        st.subheader("Gross agricultural production ($B)")
        st.dataframe(data.sort_index())

        data = data.T.reset_index()
        data = pd.melt(data, id_vars=["index"]).rename(
            columns={"index": "year", "value": "Gross Agricultural Product ($B)"}
        )
        chart = (
            alt.Chart(data)
            .mark_area(opacity=0.3)
            .encode(
                x="year:T",
                y=alt.Y("Gross Agricultural Product ($B):Q", stack=None),
                color="Region:N",
            )
        )
        st.altair_chart(chart, use_container_width=True)
except URLError as e: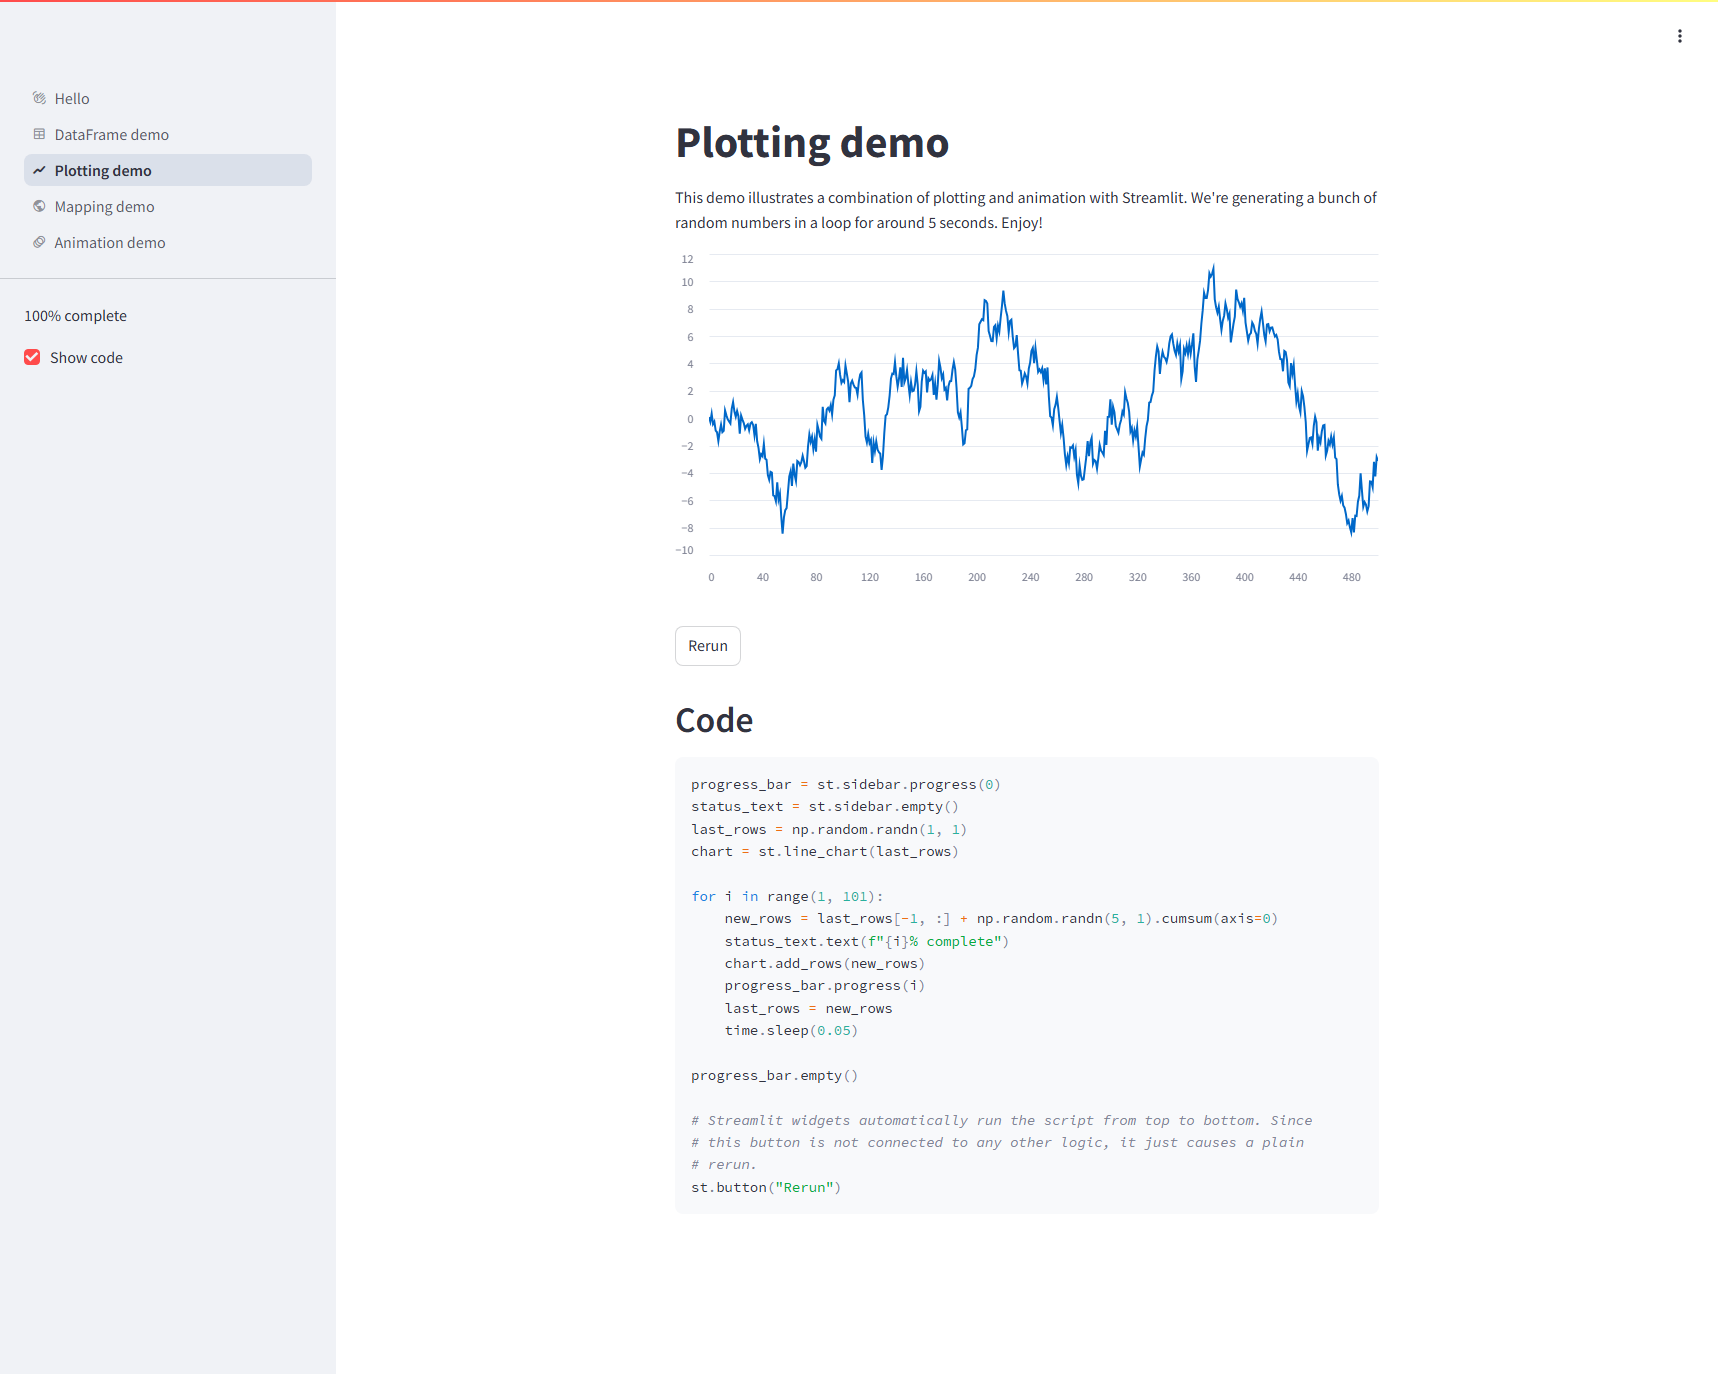
st.error(f"This demo requires internet access. Connection error: {e.reason}")- Plotting demo
progress_bar = st.sidebar.progress(0)
status_text = st.sidebar.empty()
last_rows = np.random.randn(1, 1)
chart = st.line_chart(last_rows)

for i in range(1, 101):
    new_rows = last_rows[-1, :] + np.random.randn(5, 1).cumsum(axis=0)
    status_text.text(f"{i}% complete")
    chart.add_rows(new_rows)
    progress_bar.progress(i)
    last_rows = new_rows
    time.sleep(0.05)

progress_bar.empty()

# Streamlit widgets automatically run the script from top to bottom. Since
# this button is not connected to any other logic, it just causes a plain
# rerun.
st.button("Rerun")- Mapping demo
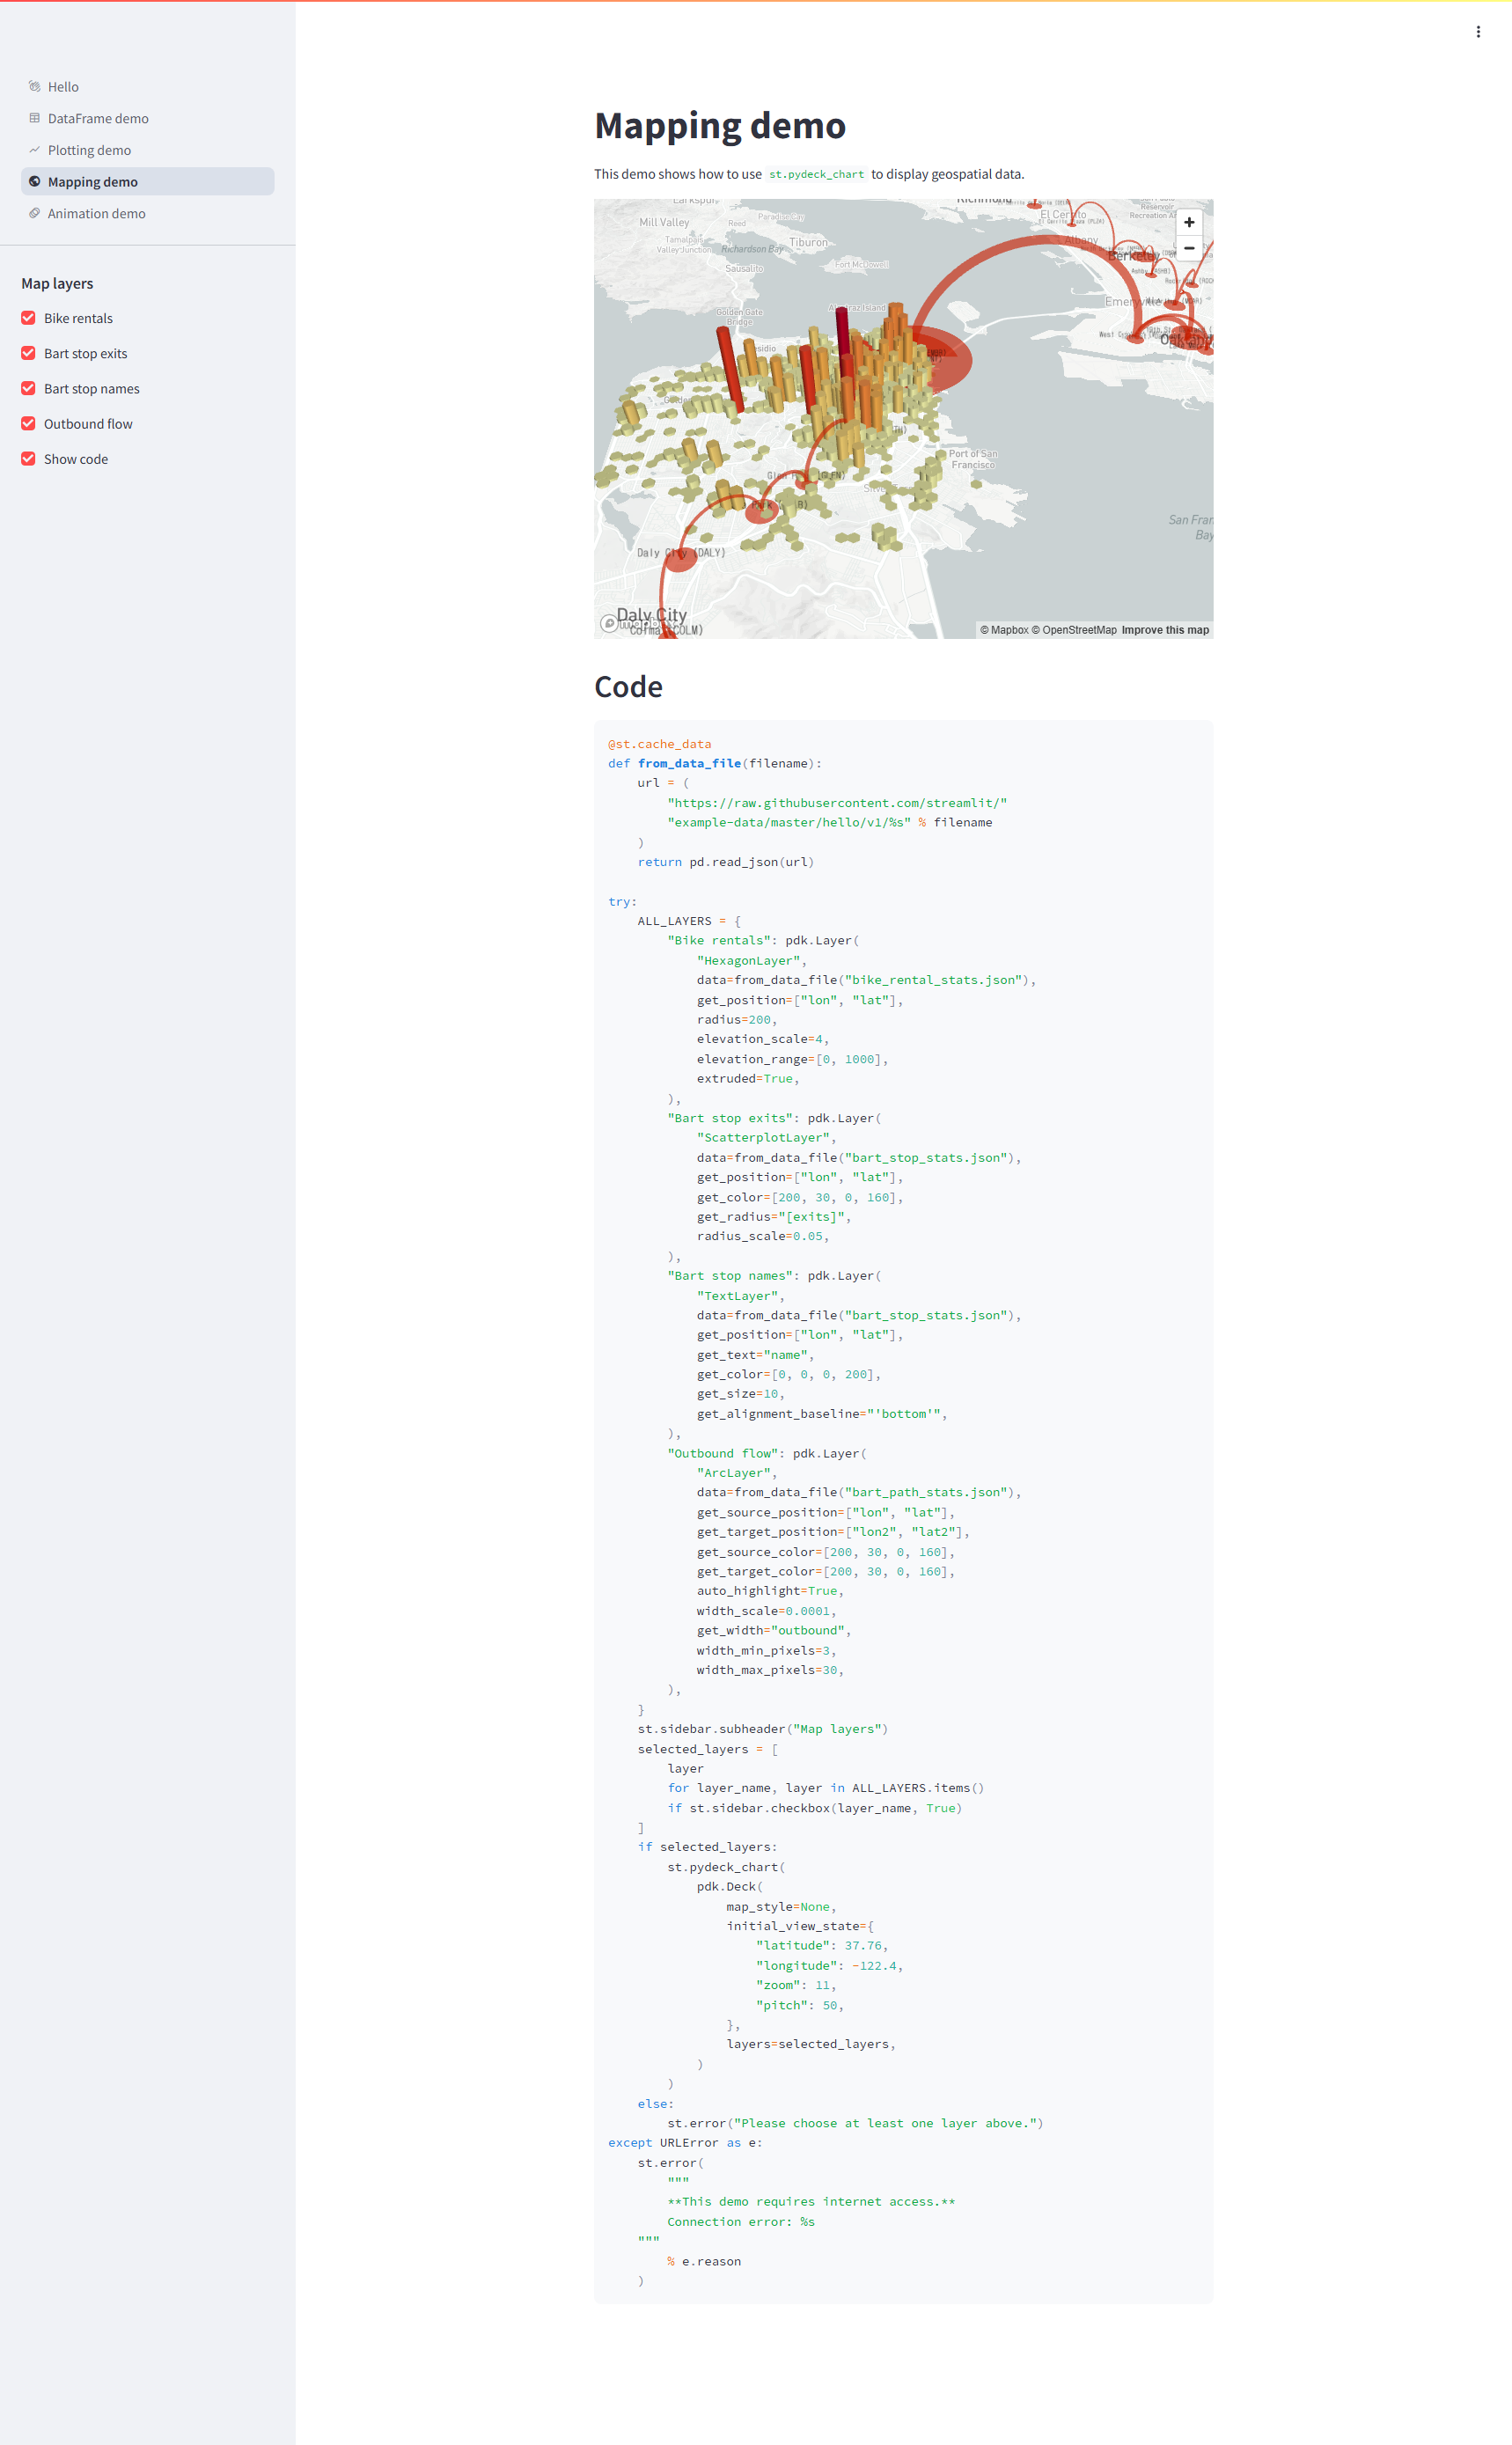
@st.cache_data
def from_data_file(filename):
    url = (
        "https://raw.githubusercontent.com/streamlit/"
        "example-data/master/hello/v1/%s" % filename
    )
    return pd.read_json(url)

try:
    ALL_LAYERS = {
        "Bike rentals": pdk.Layer(
            "HexagonLayer",
            data=from_data_file("bike_rental_stats.json"),
            get_position=["lon", "lat"],
            radius=200,
            elevation_scale=4,
            elevation_range=[0, 1000],
            extruded=True,
        ),
        "Bart stop exits": pdk.Layer(
            "ScatterplotLayer",
            data=from_data_file("bart_stop_stats.json"),
            get_position=["lon", "lat"],
            get_color=[200, 30, 0, 160],
            get_radius="[exits]",
            radius_scale=0.05,
        ),
        "Bart stop names": pdk.Layer(
            "TextLayer",
            data=from_data_file("bart_stop_stats.json"),
            get_position=["lon", "lat"],
            get_text="name",
            get_color=[0, 0, 0, 200],
            get_size=10,
            get_alignment_baseline="'bottom'",
        ),
        "Outbound flow": pdk.Layer(
            "ArcLayer",
            data=from_data_file("bart_path_stats.json"),
            get_source_position=["lon", "lat"],
            get_target_position=["lon2", "lat2"],
            get_source_color=[200, 30, 0, 160],
            get_target_color=[200, 30, 0, 160],
            auto_highlight=True,
            width_scale=0.0001,
            get_width="outbound",
            width_min_pixels=3,
            width_max_pixels=30,
        ),
    }
    st.sidebar.subheader("Map layers")
    selected_layers = [
        layer
        for layer_name, layer in ALL_LAYERS.items()
        if st.sidebar.checkbox(layer_name, True)
    ]
    if selected_layers:
        st.pydeck_chart(
            pdk.Deck(
                map_style=None,
                initial_view_state={
                    "latitude": 37.76,
                    "longitude": -122.4,
                    "zoom": 11,
                    "pitch": 50,
                },
                layers=selected_layers,
            )
        )
    else:
        st.error("Please choose at least one layer above.")
except URLError as e:
    st.error(
        """
        **This demo requires internet access.**
        Connection error: %s
    """
        % e.reason
)- Animation demo
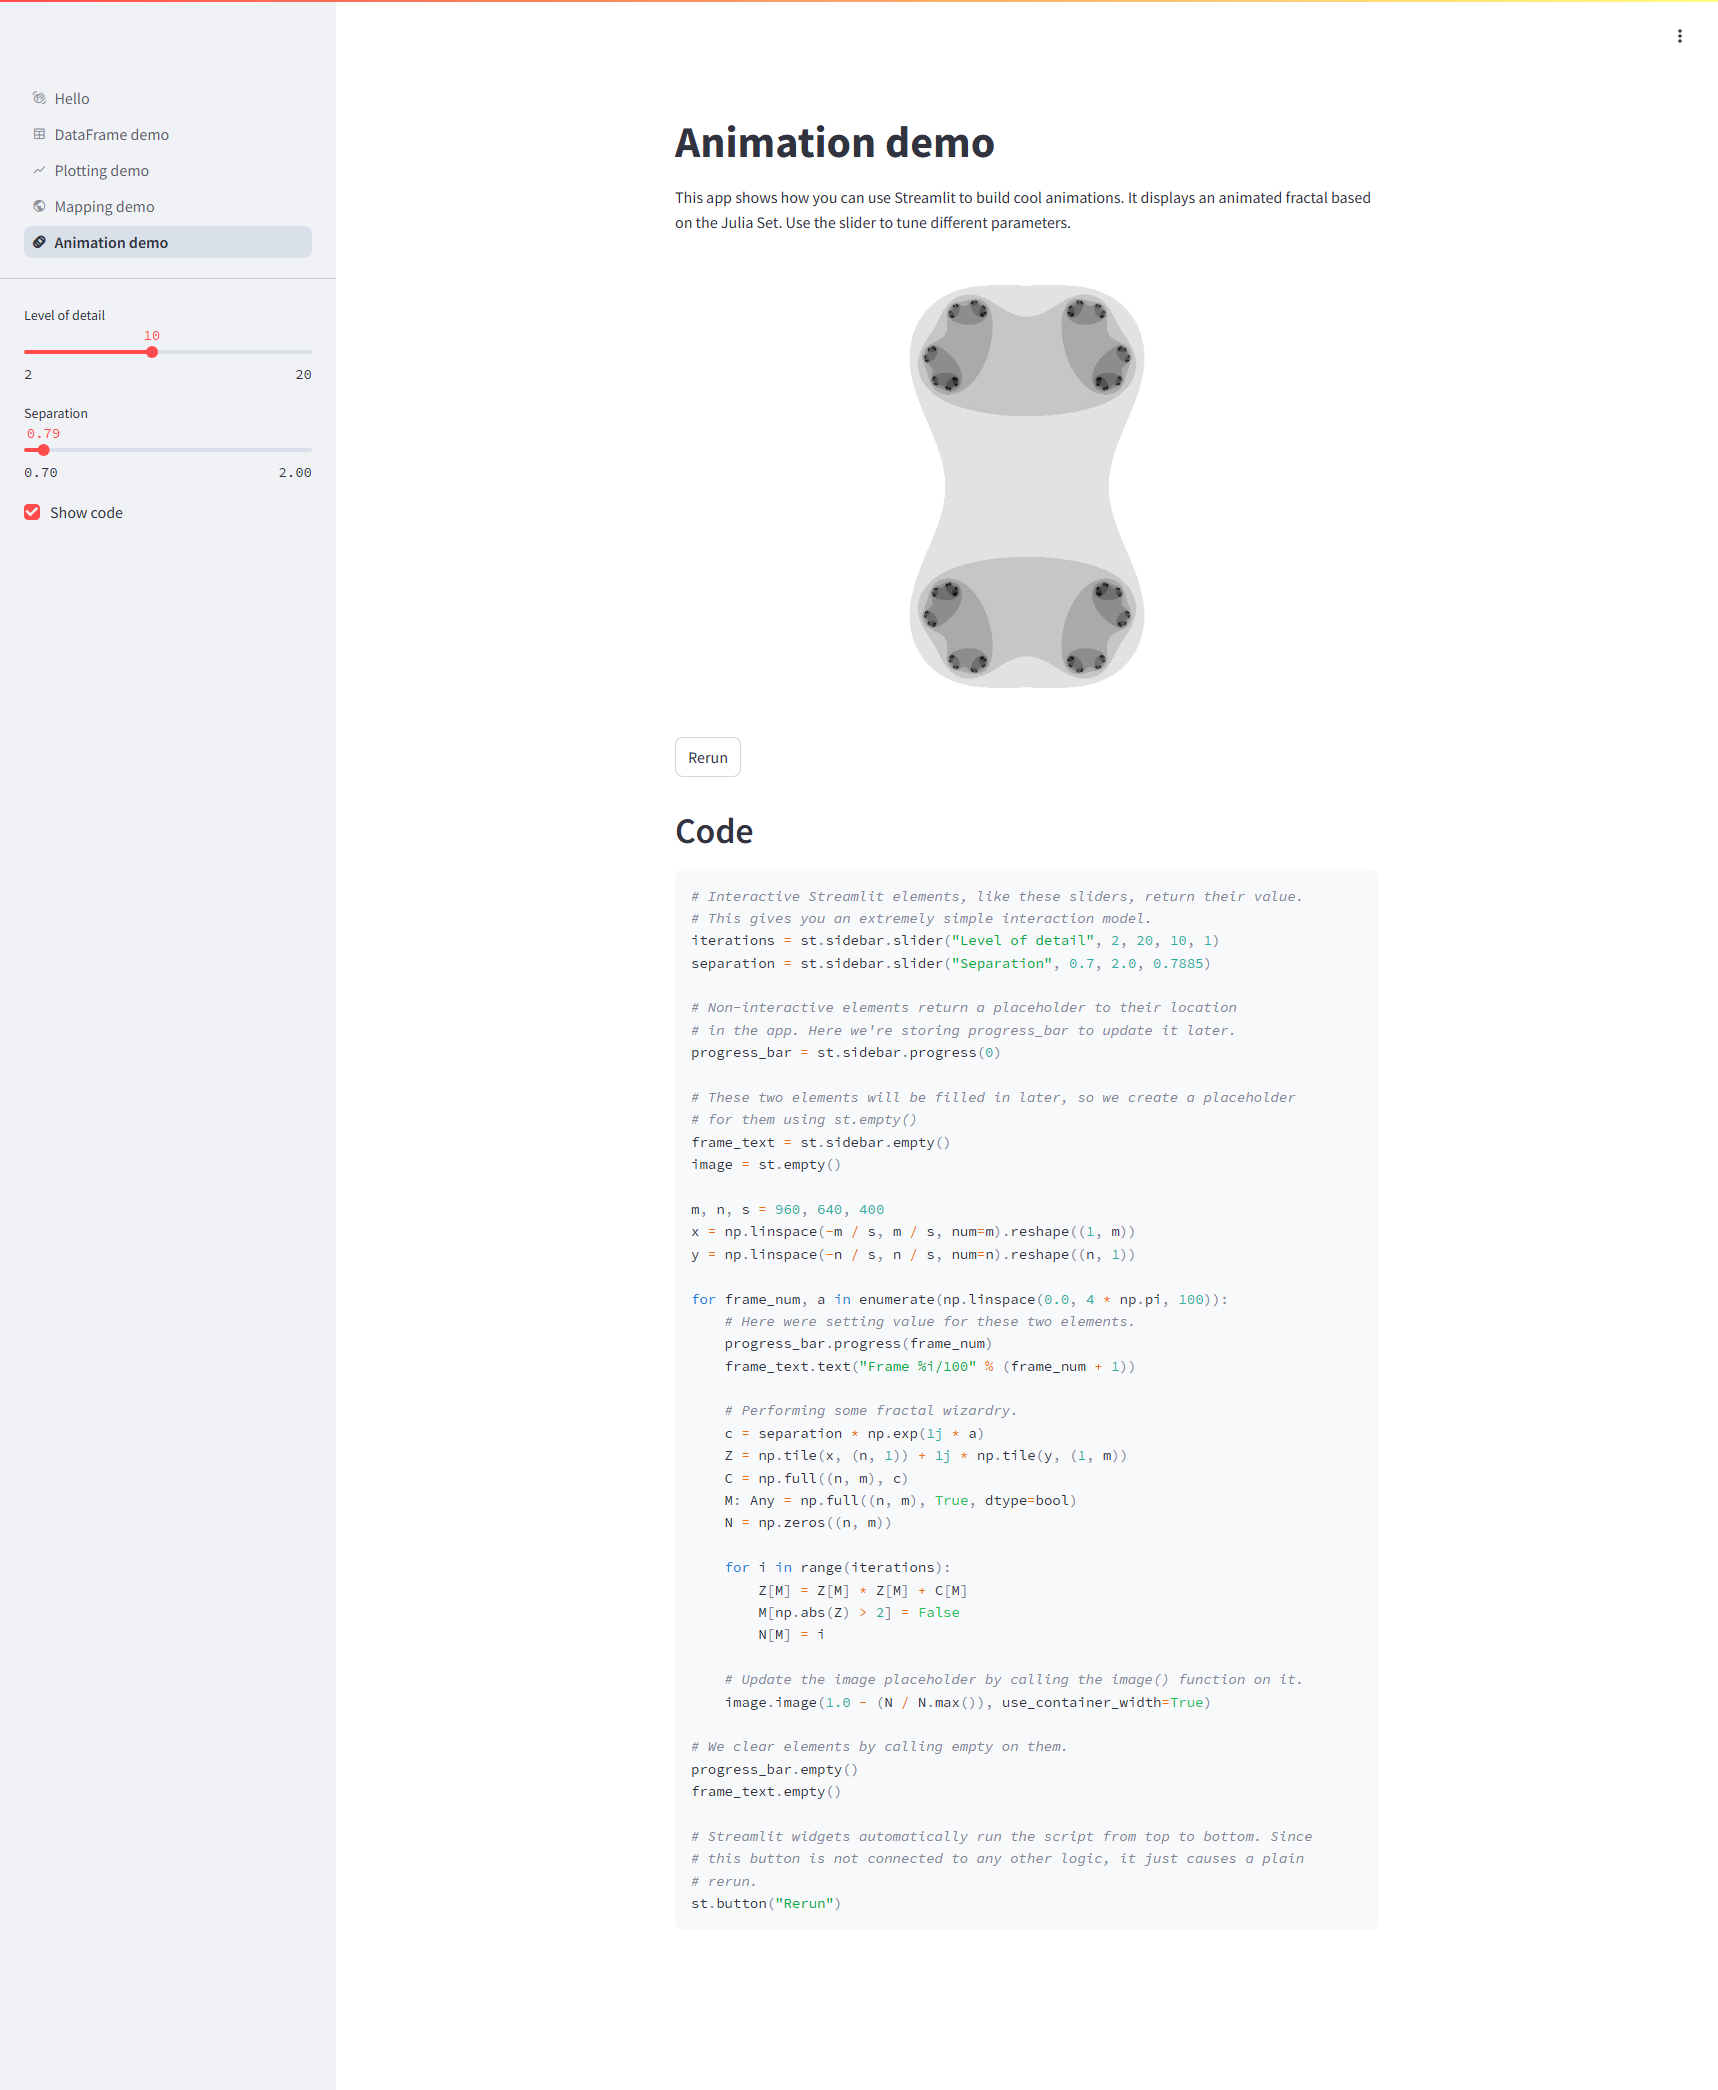
# Interactive Streamlit elements, like these sliders, return their value.
# This gives you an extremely simple interaction model.
iterations = st.sidebar.slider("Level of detail", 2, 20, 10, 1)
separation = st.sidebar.slider("Separation", 0.7, 2.0, 0.7885)

# Non-interactive elements return a placeholder to their location
# in the app. Here we're storing progress_bar to update it later.
progress_bar = st.sidebar.progress(0)

# These two elements will be filled in later, so we create a placeholder
# for them using st.empty()
frame_text = st.sidebar.empty()
image = st.empty()

m, n, s = 960, 640, 400
x = np.linspace(-m / s, m / s, num=m).reshape((1, m))
y = np.linspace(-n / s, n / s, num=n).reshape((n, 1))

for frame_num, a in enumerate(np.linspace(0.0, 4 * np.pi, 100)):
    # Here were setting value for these two elements.
    progress_bar.progress(frame_num)
    frame_text.text("Frame %i/100" % (frame_num + 1))

    # Performing some fractal wizardry.
    c = separation * np.exp(1j * a)
    Z = np.tile(x, (n, 1)) + 1j * np.tile(y, (1, m))
    C = np.full((n, m), c)
    M: Any = np.full((n, m), True, dtype=bool)
    N = np.zeros((n, m))

    for i in range(iterations):
        Z[M] = Z[M] * Z[M] + C[M]
        M[np.abs(Z) > 2] = False
        N[M] = i

    # Update the image placeholder by calling the image() function on it.
    image.image(1.0 - (N / N.max()), use_container_width=True)

# We clear elements by calling empty on them.
progress_bar.empty()
frame_text.empty()

# Streamlit widgets automatically run the script from top to bottom. Since
# this button is not connected to any other logic, it just causes a plain
# rerun.
st.button("Rerun")
📌 3.2 첫 번째 Streamlit 앱 실행
hello_streamlit.py
import streamlit as st

st.title("Hello Streamlit! 🚀")
st.write("이것은 Streamlit으로 만든 간단한 웹 애플리케이션입니다.")- 실행 명령어:
streamlit run hello_streamlit.pystreamlit run으로 파이썬 함수를 실행하여http://localhost:8501/에서 Streamlit을 실행할 수 있습니다.

4. Streamlit 주요 API 소개
📊 API DEMO 출력 결과 이미지는 아래 DataCamp의 출력 결과 이미지를 활용했습니다.
- Image Source: https://www.datacamp.com/tutorial/streamlit
📌 4.1 텍스트 출력
- Streamlit은 다양한 방식으로 텍스트를 표시할 수 있습니다.
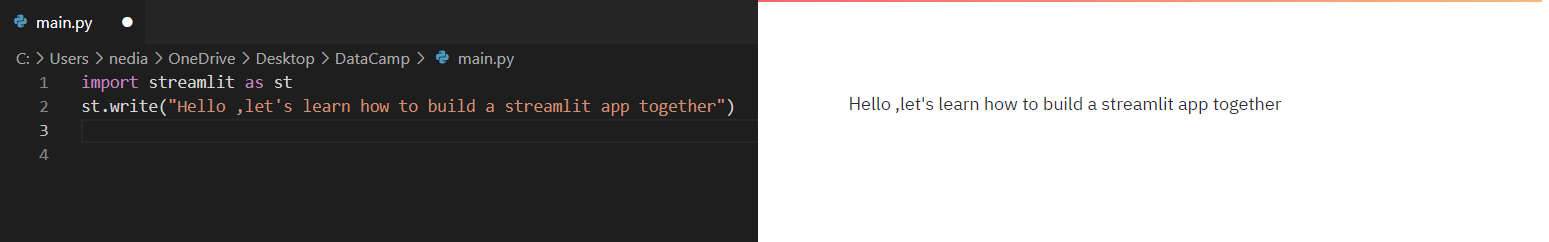
Image Source: https://www.datacamp.com/tutorial/streamlit
st.write()
-
설명: 문자열, 숫자, 데이터프레임, 리스트, 객체 등을 출력할 수 있는 범용 출력 함수입니다.
-
사용 예시:
  st.write("안녕하세요, Streamlit입니다!")
  st.write(12345)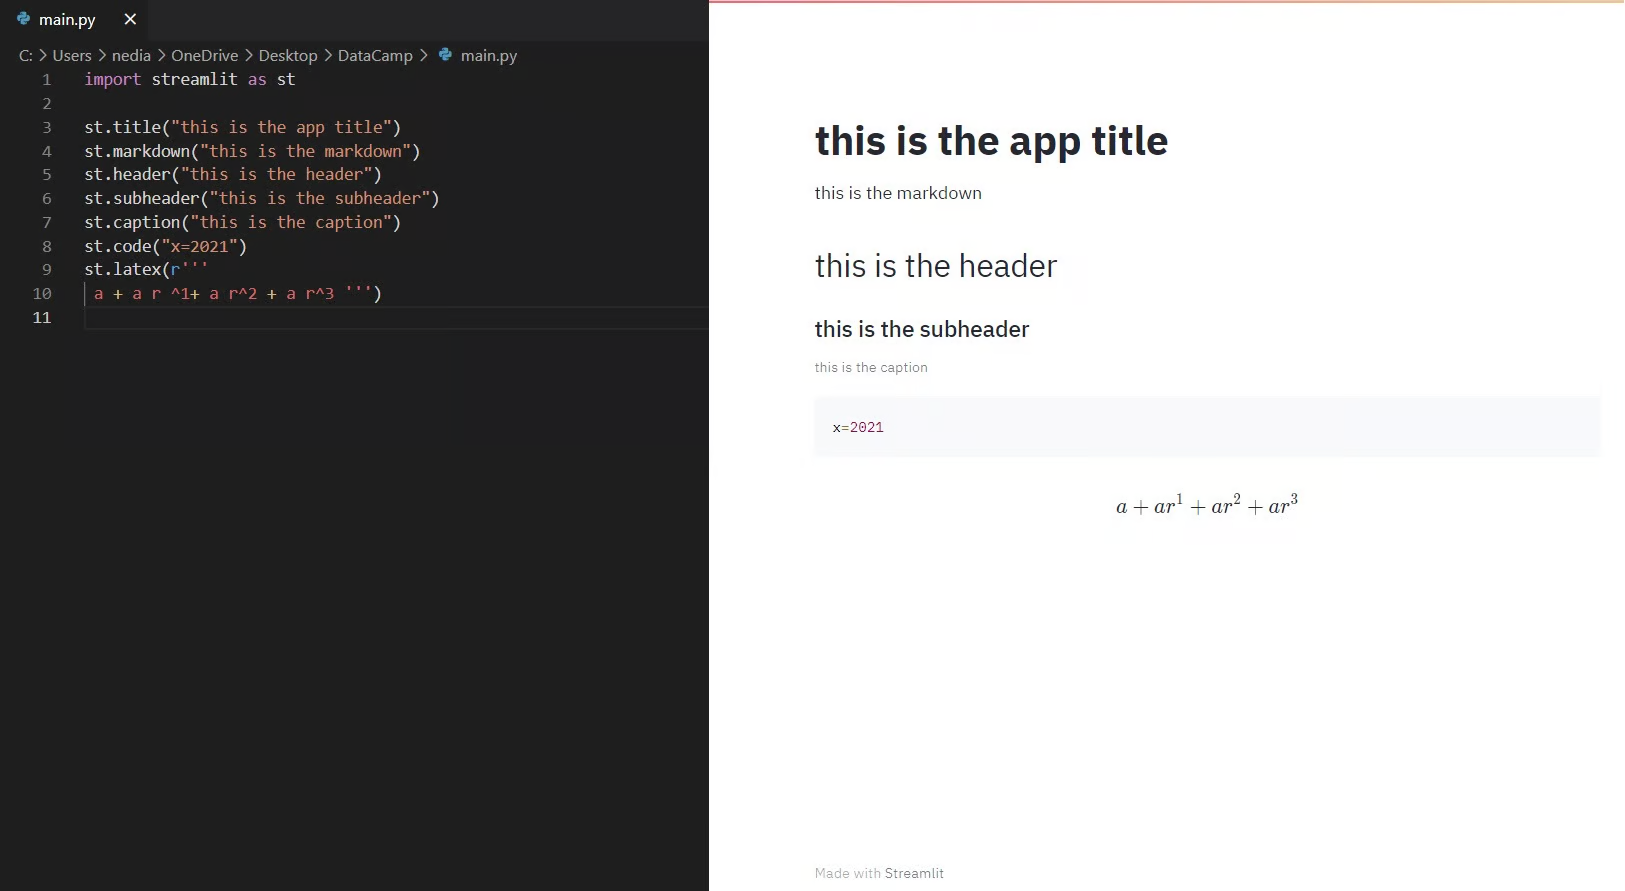
Image Source: https://www.datacamp.com/tutorial/streamlit
st.title()
-
설명: 애플리케이션의 제목을 설정하는 함수입니다. 가장 큰 글씨 크기로 표시됩니다.
-
사용 예시:
st.title("Streamlit 웹 애플리케이션")
st.header()
-
설명: 헤더(큰 제목) 를 설정하는 함수로,
st.title()보다 크기가 작지만, 주요 섹션을 나누는 데 유용합니다. -
사용 예시:
st.header("이것은 헤더입니다")st.subheader()
-
설명: 서브헤더(소제목) 를 설정하는 함수로,
st.header()보다 작은 크기의 제목입니다. -
사용 예시:
st.subheader("이것은 서브헤더입니다")st.markdown()
-
설명: Markdown 문법을 사용하여 텍스트를 포맷할 수 있습니다.
-
사용 예시:
  st.markdown("# 큰 제목 (Markdown)")
  st.markdown("**굵은 글씨**와 *이탤릭체* 사용 가능")
st.caption()
-
설명: 설명이나 주석을 다는 캡션을 추가하는 함수로, 작은 글씨로 표시됩니다.
-
사용 예시:
st.caption("이것은 캡션(설명)입니다.")st.code()
-
설명: Python 코드 또는 다른 프로그래밍 언어 코드를 하이라이팅된 코드 블록으로 출력합니다.
-
사용 예시:
  st.code("""
          def hello():
              print("Hello, Streamlit!")
          """, language="python")
st.latex()
-
설명: LaTeX 문법을 사용하여 수식을 렌더링할 수 있습니다.
-
사용 예시:
st.latex(r"E = mc^2")📌 4.2 사용자 입력 받기
- Streamlit은 다양한 입력 위젯을 제공하여 사용자로부터 데이터를 입력받을 수 있습니다.
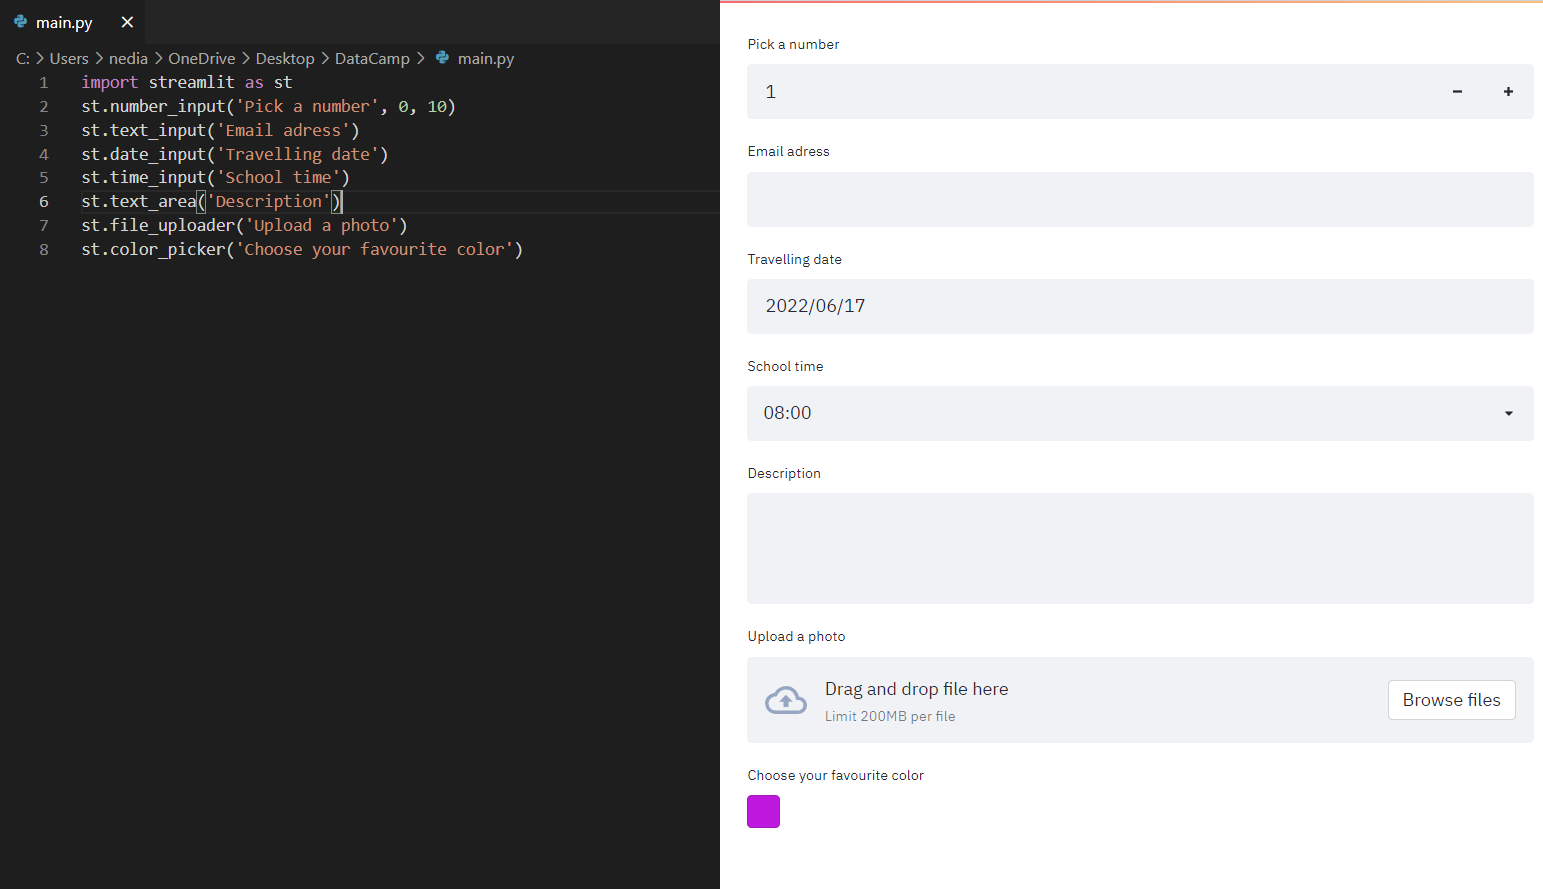
Image Source: https://www.datacamp.com/tutorial/streamlit
1. 텍스트 입력 (st.text_input())
-
설명: 사용자가 텍스트를 입력할 수 있는 입력 상자를 제공합니다.
-
예제:
  name = st.text_input("이름을 입력하세요")
  st.write(f"입력된 이름: {name}")
2. 숫자 입력 (st.number_input())
-
설명: 사용자가 숫자를 입력할 수 있도록 합니다.
-
예제:
  age = st.number_input("나이를 입력하세요", min_value=0, max_value=100, step=1)
  st.write(f"입력된 나이: {age}")
3. 날짜 입력 (st.date_input())
-
설명: 사용자가 날짜를 선택할 수 있도록 합니다.
-
예제:
  selected_date = st.date_input("날짜 선택")
  st.write(f"선택한 날짜: {selected_date}")
4. 시간 입력 (st.time_input())
-
설명: 사용자가 시간을 선택할 수 있도록 합니다.
-
예제:
  selected_time = st.time_input("시간 선택")
  st.write(f"선택한 시간: {selected_time}")
5. 여러 줄 입력 (st.text_area())
-
설명: 여러 줄의 텍스트를 입력할 수 있는 입력 필드를 제공합니다.
-
예제:
  message = st.text_area("메시지를 입력하세요")
  st.write(f"입력된 메시지:\n{message}")
6. 파일 업로드 (st.file_uploader())
-
설명: 사용자가 파일을 업로드할 수 있도록 합니다.
-
예제:
  uploaded_file = st.file_uploader("파일을 업로드하세요")
  if uploaded_file is not None:
      st.write("업로드된 파일:", uploaded_file.name)
7. 색상 선택 (st.color_picker())
-
설명: 색상을 선택할 수 있도록 합니다.
-
예제:
  color = st.color_picker("색상을 선택하세요", <"#00f900")
  st.write(f"선택한 색상: {color}")
📌 4.3 버튼 및 선택형 입력
- Streamlit은 다양한 버튼 및 선택형 입력 위젯을 제공하여 인터랙티브한 UI를 만들 수 있습니다.
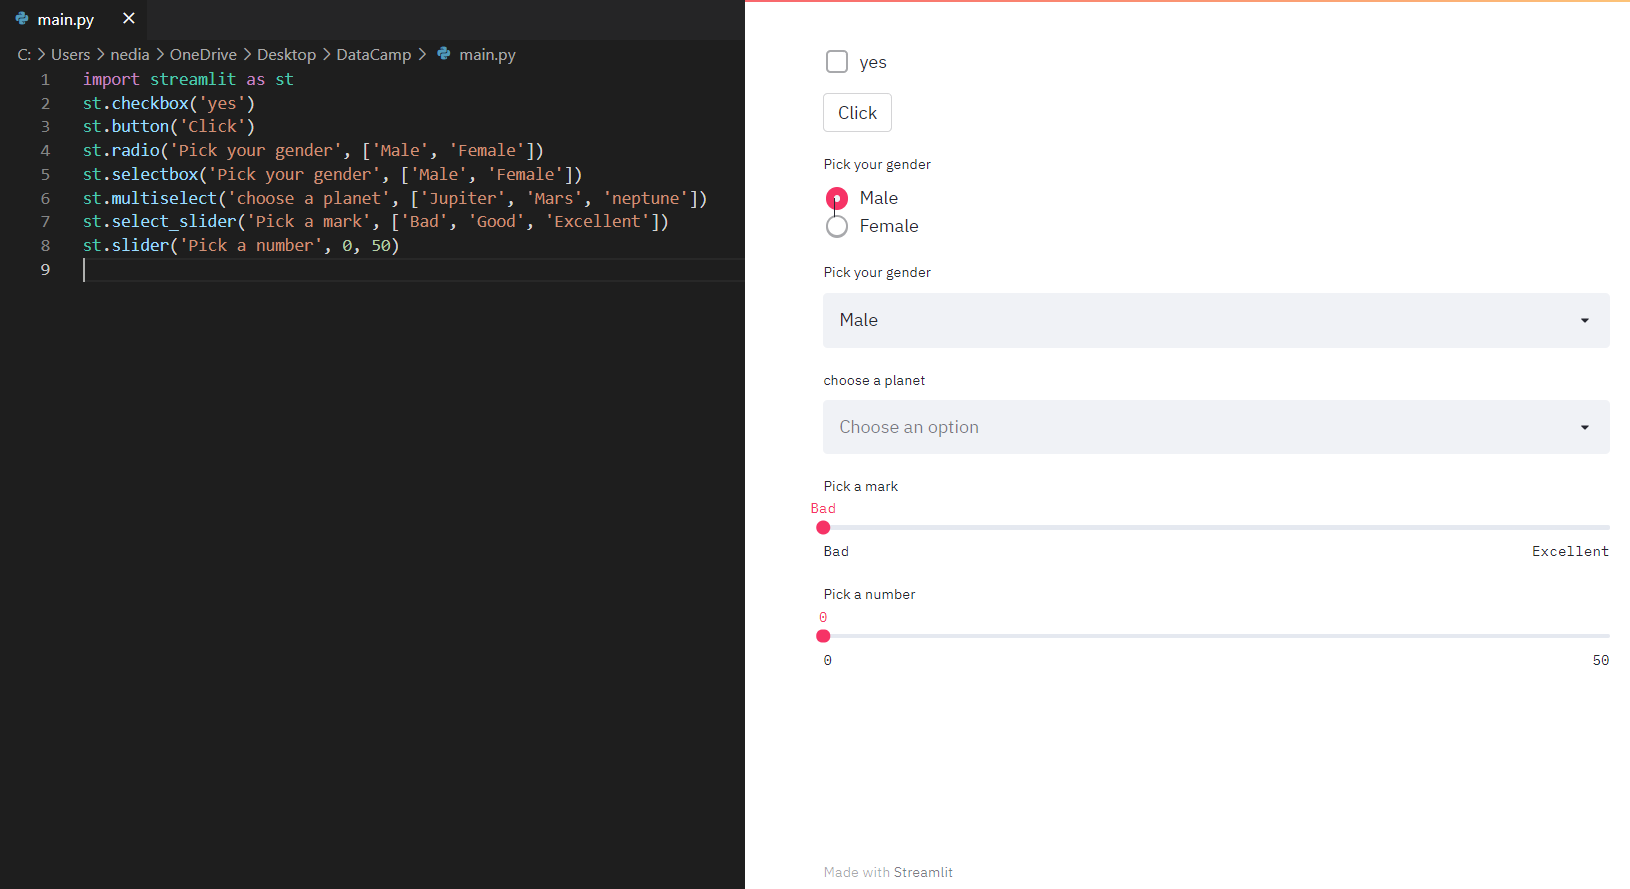
Image Source: https://www.datacamp.com/tutorial/streamlit
1. 버튼 (st.button())
-
설명: 사용자가 버튼을 클릭하면 특정 동작을 실행할 수 있도록 합니다.
-
예제:
  if st.button("클릭하세요"):
      st.write("버튼이 클릭되었습니다!")
2. 체크박스 (st.checkbox())
- 설명: 체크박스를 추가하여 사용자가 선택할 수 있도록 합니다.
- 예제:
  agree = st.checkbox("동의합니다")
  if agree:
      st.write("동의하셨습니다!")
3. 라디오 버튼 (st.radio())
- 설명: 여러 옵션 중 하나를 선택할 수 있도록 합니다.
- 예제:
  selected_option = st.radio("옵션을 선택하세요", ("옵션 1", "옵션 2", "옵션 3"))
  st.write(f"선택된 옵션: {selected_option}")
4. 드롭다운 선택 (st.selectbox())
- 설명: 드롭다운 리스트에서 하나의 옵션을 선택할 수 있습니다.
- 예제:
  fruit = st.selectbox("과일을 선택하세요", ["사과", "바나나", "오렌지"])
  st.write(f"선택한 과일: {fruit}")
5. 다중 선택 (st.multiselect())
- 설명: 여러 개의 옵션을 동시에 선택할 수 있습니다.
- 예제:
  planets = st.multiselect("행성을 선택하세요", ["목성", "화성", "해왕성"])
  st.write(f"선택한 행성: {planets}")
6. 슬라이더 (st.slider())
- 설명: 슬라이더를 사용하여 숫자 값을 조정할 수 있습니다.
- 예제:
  number = st.slider("숫자를 선택하세요", 0, 50)
  st.write(f"선택된 숫자: {number}")
7. 선택 슬라이더 (st.select_slider())
- 설명: 리스트에서 정해진 값을 선택하는 슬라이더입니다.
- 예제:
  rating = st.select_slider("평가를 선택하세요", ["나쁨", "보통", "좋음", "최고"])
  st.write(f"선택한 평가: {rating}")
📌 4.4 데이터 출력
- Streamlit을 활용하면 이미지, 비디오, 오디오 파일뿐만 아니라 데이터프레임, JSON, 주요 지표(Metrics) 등을 쉽게 출력할 수 있습니다.
1. 이미지, 비디오 및 오디오 파일 출력
- Streamlit에서는 간단한 함수 호출만으로 다양한 미디어 파일을 표시할 수 있습니다.
(1) 이미지 출력 (st.image())
-
설명: 이미지를 출력하는 함수입니다.
PIL.Image객체 또는 이미지 URL, 로컬 파일 경로를 사용할 수 있습니다. -
예제:
  import streamlit as st
  from PIL import Image

  image = Image.open("example.jpg")  -  로컬 이미지 파일
  st.image(image, caption="예제 이미지", use_column_width=True)
(2) 오디오 출력 (st.audio())
-
설명: 오디오 파일을 웹에서 재생할 수 있도록 합니다.
-
예제:
st.audio("example.mp3")(3) 비디오 출력 (st.video())
-
설명: 비디오 파일을 웹에서 재생할 수 있도록 합니다.
-
예제:
st.video("example.mp4")2. 데이터프레임 출력
- Streamlit은
pandas데이터프레임을 여러 방식으로 표시할 수 있습니다.
(1) 기본 데이터 출력 (st.write())
-
설명:
st.write()를 사용하면 데이터프레임을 기본적인 형태로 출력할 수 있습니다. -
예제:
st.write(df)(2) 인터랙티브 데이터프레임 (st.dataframe())
-
설명:
st.dataframe()을 사용하면 스크롤 및 정렬 기능이 포함된 인터랙티브한 데이터프레임을 출력할 수 있습니다. -
예제:
st.dataframe(df)(3) 정적 테이블 (st.table())
-
설명:
st.table()은 정적인 테이블 형태로 데이터를 출력하며, 데이터 변경이 필요 없을 때 유용합니다. -
예제:
st.table(df)3. JSON 데이터 출력 (st.json())
-
설명: JSON 형태의 데이터를 계층적으로 정리된 형태로 출력할 수 있습니다.
-
예제:
  st.json({
      '이름': '이시현',
      '나이': 24,
      '거주지': '광주'
  })
4. 주요 지표 및 통계 출력 (st.metric())
- 설명: 특정 지표(metric) 를 강조해서 보여줄 때 사용됩니다.
delta값을 설정하면 변화량을 함께 표시할 수 있습니다.
예제(지표 출력)
st.metric(label="LG전자", value="78,000원", delta="2.12%")
st.metric(label="현대차", value="150,000원", delta="-1.25%")
📌 4.5 차트 및 지도 출력
- 데이터 시각화는 데이터를 더욱 직관적으로 이해하고 인사이트를 얻는 데 중요한 역할을 합니다. Streamlit을 활용하면 간단한 코드로 다양한 차트와 지도 데이터를 시각화할 수 있습니다.
1. 차트 출력
- Streamlit은 다양한 차트 라이브러리를 지원하며,
matplotlib,pandas,Altair,Graphviz등의 그래프를 쉽게 생성할 수 있습니다.
(1) Matplotlib 그래프 (st.pyplot())
-
설명:
matplotlib.pyplot을 사용하여 생성한 그래프를 Streamlit 앱에 표시할 수 있습니다.Matplotlib은 Python에서 가장 널리 사용되는 시각화 라이브러리로, 세밀한 커스터마이징이 필요한 경우 유용합니다.- 히스토그램, 산점도, 선 그래프, 막대 그래프 등 다양한 그래프를 직접 제어할 수 있습니다.
- 예제:
  import streamlit as st
  import matplotlib.pyplot as plt
  import numpy as np

  rand = np.random.normal(1, 2, size=20)  # 정규분포 난수 생성
  fig, ax = plt.subplots()
  ax.hist(rand, bins=15)  # 히스토그램 그리기
  st.pyplot(fig)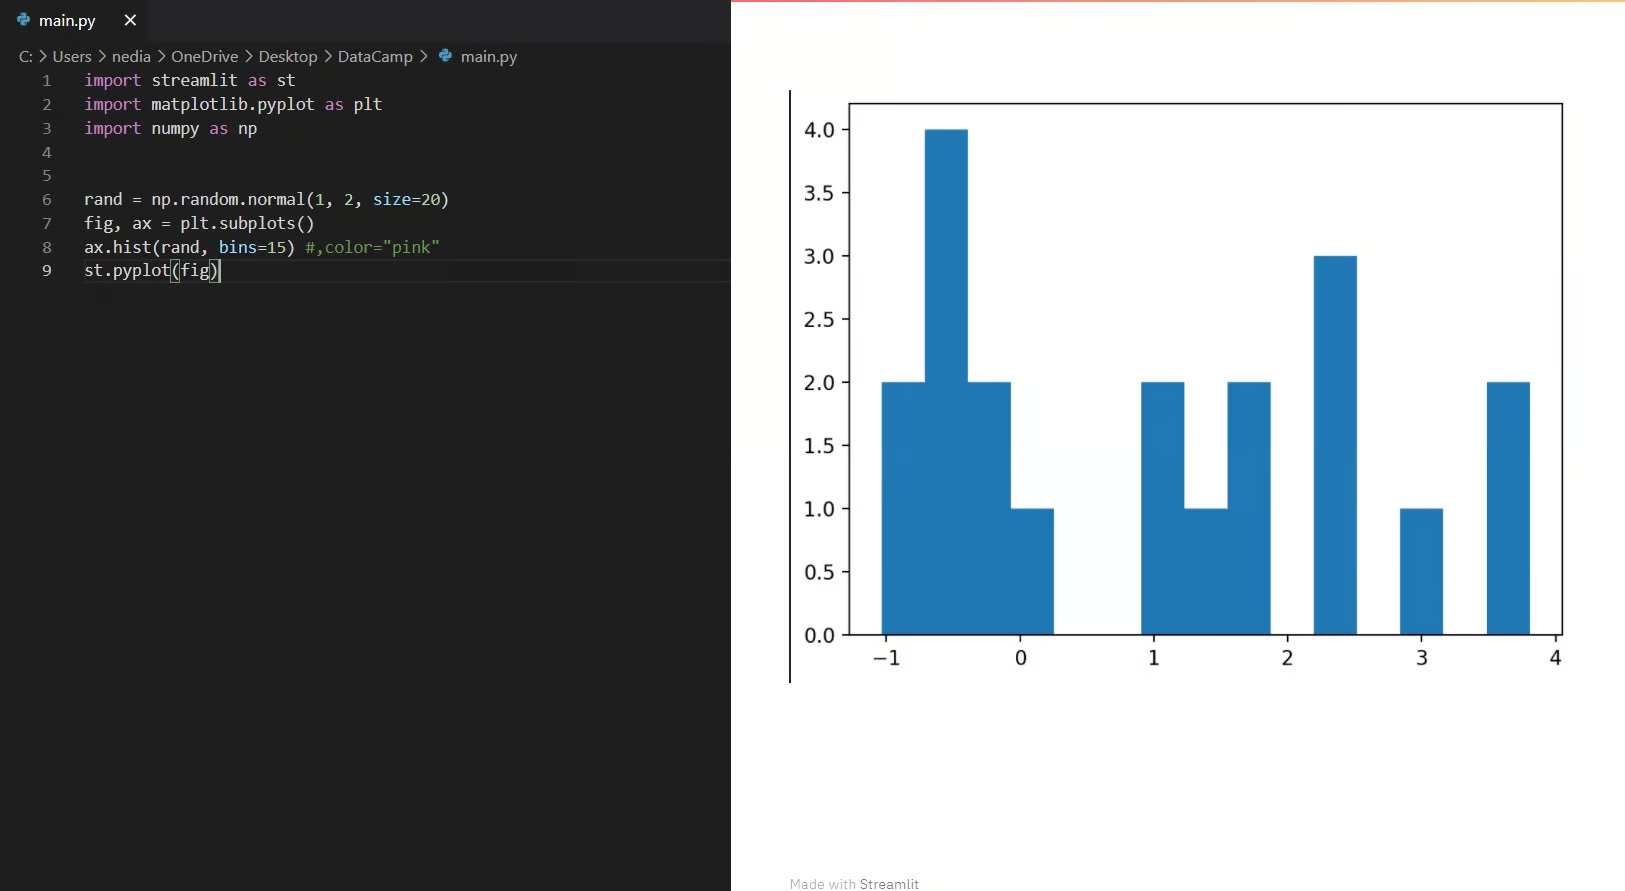
Image Source: https://www.datacamp.com/tutorial/streamlit
(2) 선형 차트 (st.line_chart())
-
설명: Pandas 데이터프레임을 이용하여 선형 차트를 그립니다.
- 시간에 따른 변화를 시각화할 때 사용됩니다.
- 시계열 데이터, 주가 변동, 트렌드 분석 등에서 유용합니다.
-
예제:
  import streamlit as st
  import pandas as pd
  import numpy as np

  df = pd.DataFrame(np.random.randn(10, 2), columns=['x', 'y'])
  st.line_chart(df)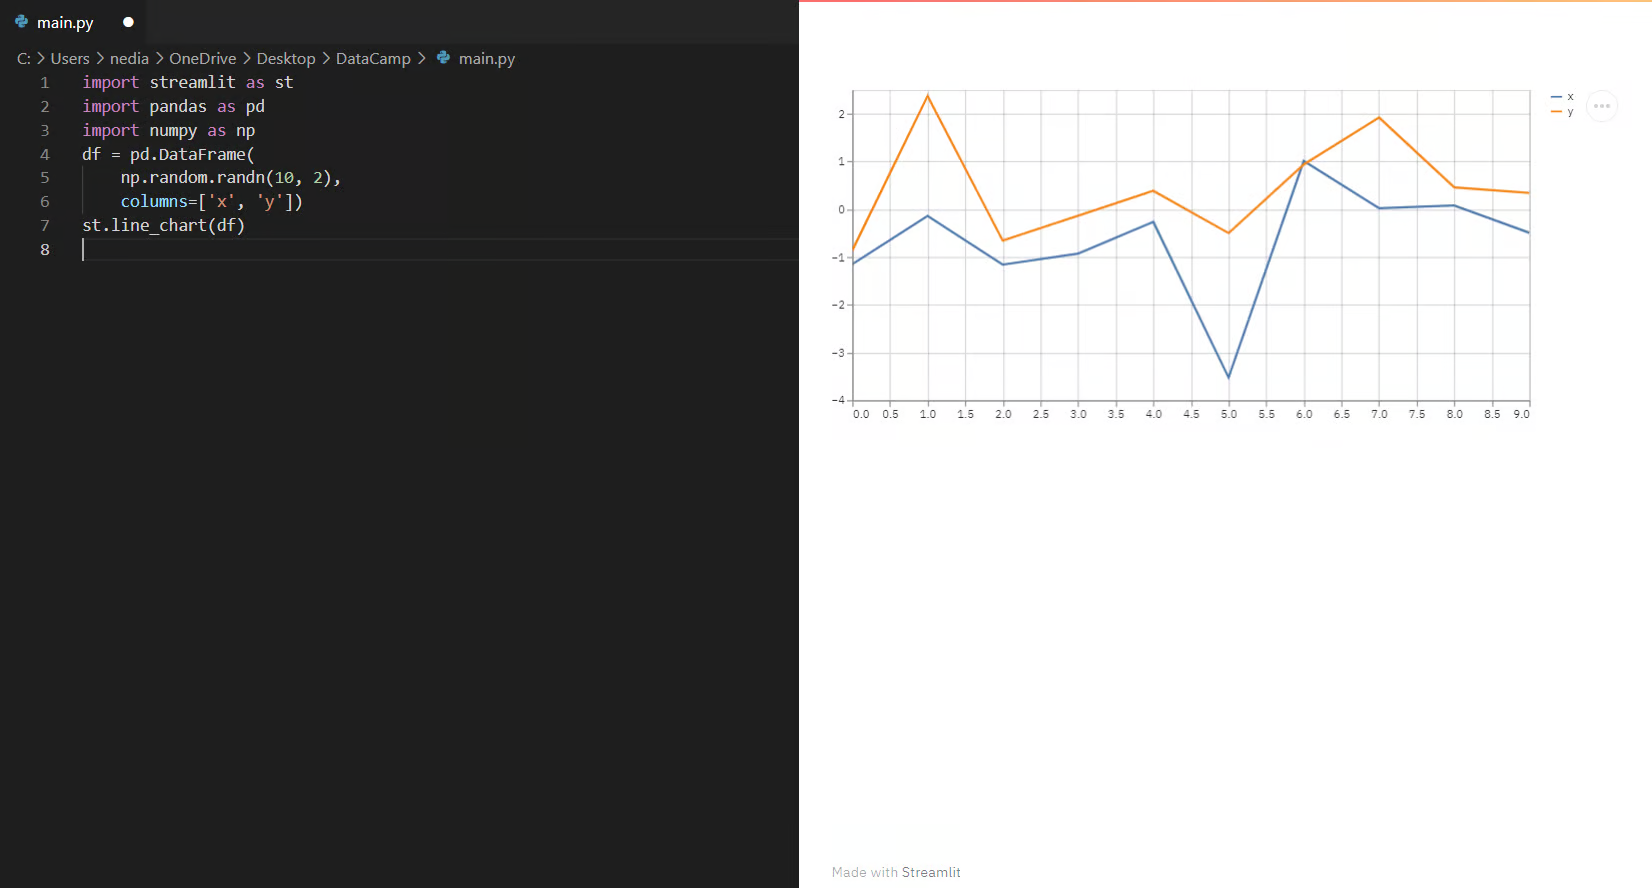
Image Source: https://www.datacamp.com/tutorial/streamlit
(3) 막대 차트 (st.bar_chart())
-
설명: Pandas 데이터프레임을 이용하여 막대 차트를 생성합니다.
- 카테고리별 비교를 할 때 적절한 차트입니다.
- 각 범주의 크기 차이를 강조하는 데 유용합니다.
-
예제:
  import streamlit as st
  import pandas as pd
  import numpy as np

  df = pd.DataFrame(np.random.randn(10, 2), columns=['x', 'y'])
  st.bar_chart(df)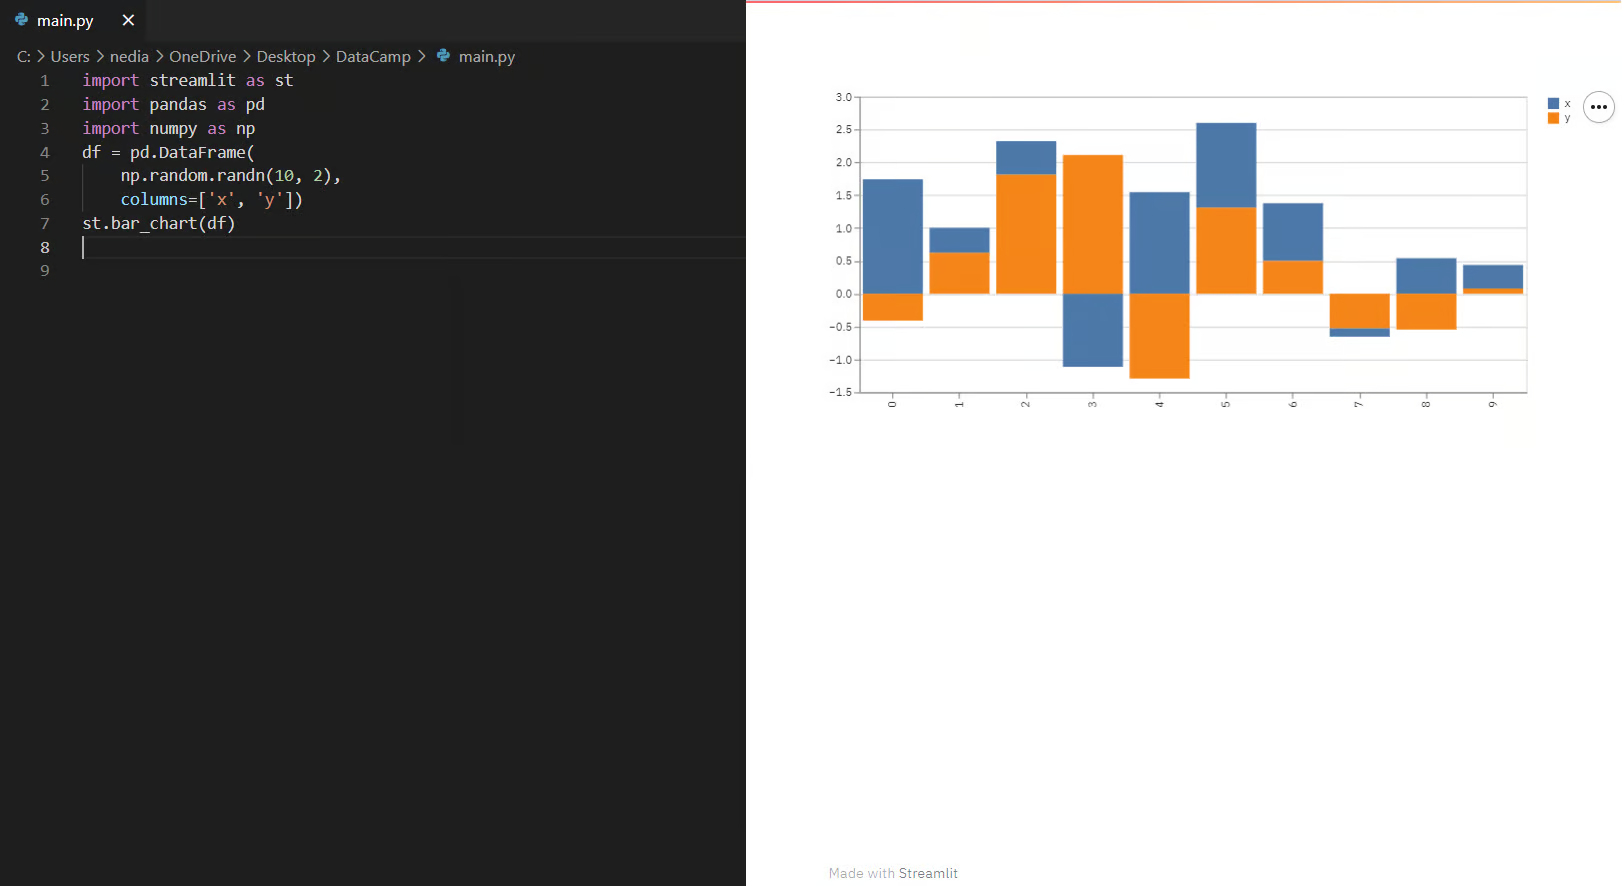
Image Source: https://www.datacamp.com/tutorial/streamlit
(4) 영역 차트 (st.area_chart())
-
설명: Pandas 데이터프레임을 이용하여 영역 차트를 생성합니다.
- 선형 차트와 유사하지만, 누적된 값의 변화를 강조할 때 유용합니다.
- 전체적인 변화 흐름과 차이를 강조할 때 사용됩니다.
-
예제:
  import streamlit as st
  import pandas as pd
  import numpy as np

  df = pd.DataFrame(np.random.randn(10, 2), columns=['x', 'y'])
  st.area_chart(df)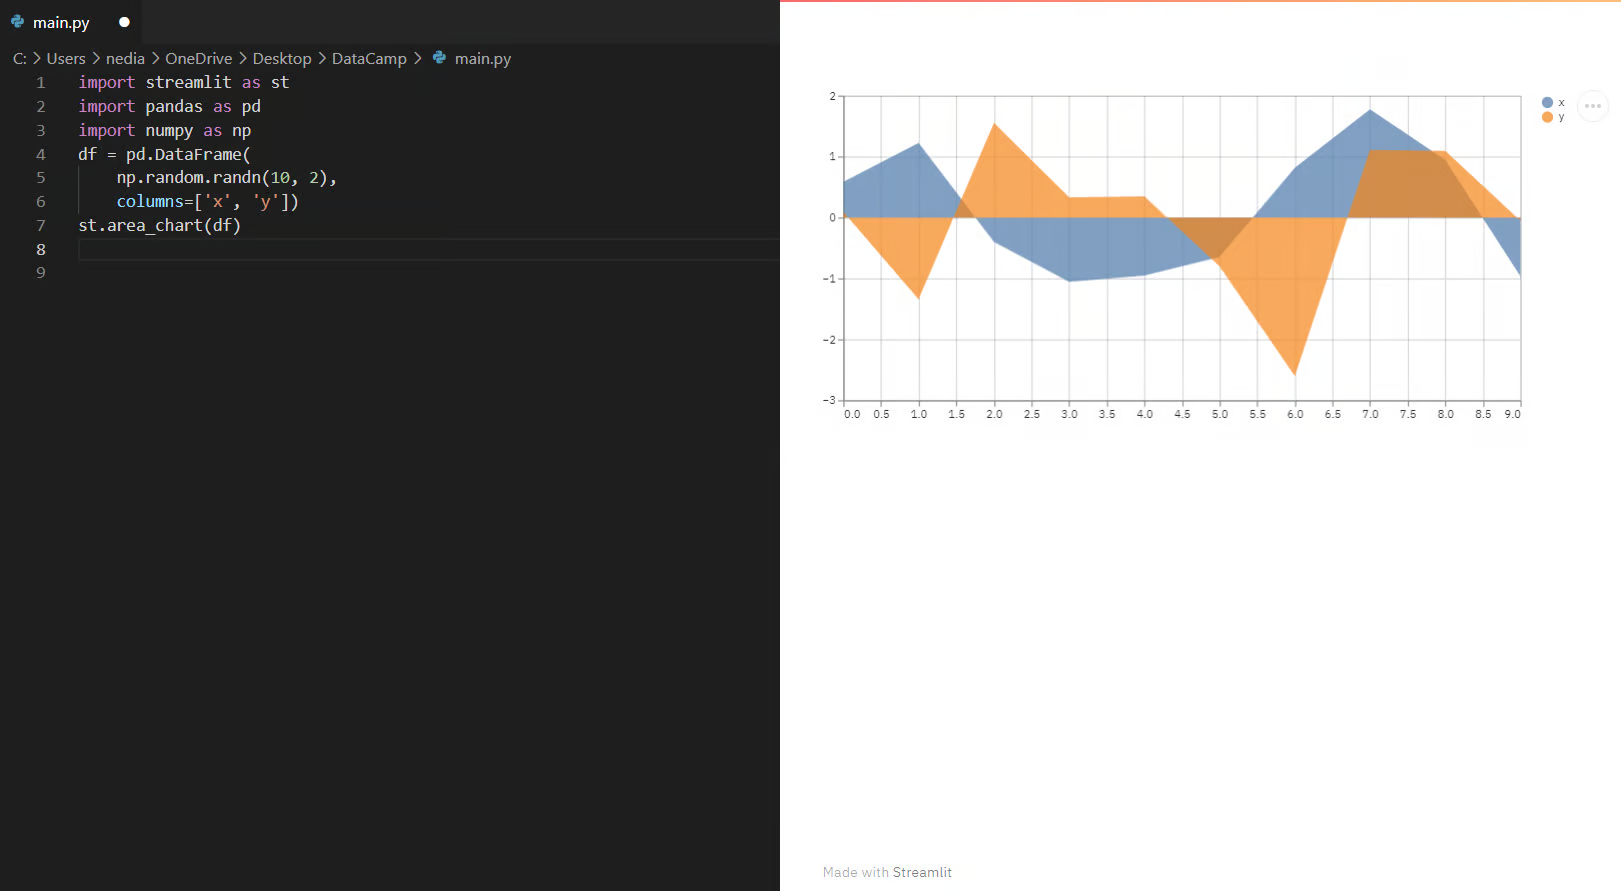
Image Source: https://www.datacamp.com/tutorial/streamlit
(5) Altair 차트 (st.altair_chart())
-
설명:
Altair를 사용하여 인터랙티브한 차트를 생성합니다.- 대규모 데이터 분석 및 상호작용이 필요한 경우 적합합니다.
- 산점도, 버블 차트 등 다차원 데이터를 시각화하는 데 유용합니다.
-
예제:
  import streamlit as st
  import pandas as pd
  import numpy as np
  import altair as alt

  df = pd.DataFrame(np.random.randn(500, 3), columns=['x', 'y', 'z'])
  chart = alt.Chart(df).mark_circle().encode(
      x='x', y='y', size='z', color='z', tooltip=['x', 'y', 'z']
  )
  st.altair_chart(chart, use_container_width=True)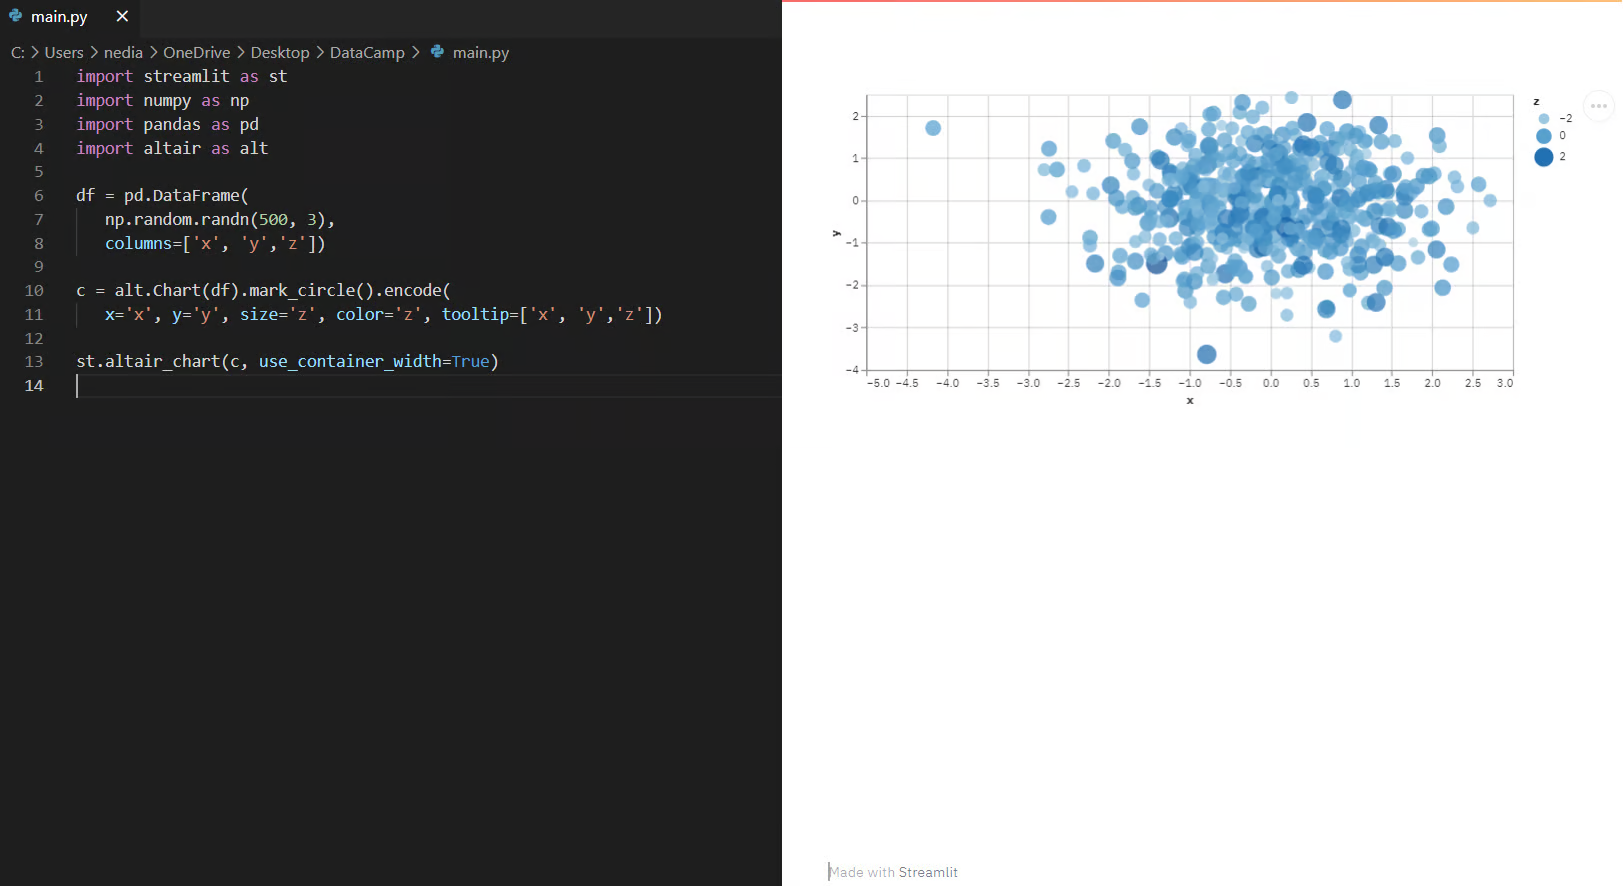
Image Source: https://www.datacamp.com/tutorial/streamlit
(6) 그래프 구조 시각화 (st.graphviz_chart())
-
설명:
graphviz를 이용해 노드 및 엣지 기반 그래프를 생성할 수 있습니다.- 노드와 엣지 기반 네트워크를 표현하는 데 유용합니다.
- 계층 구조, 프로세스 흐름도, 관계 모델링 등에 사용됩니다.
-
예제:
  import streamlit as st
  import graphviz

  st.graphviz_chart('''
      digraph {
          Big_shark -> Tuna
          Tuna -> Mackerel
          Mackerel -> Small_fishes
          Small_fishes -> Shrimp
      }
  ''')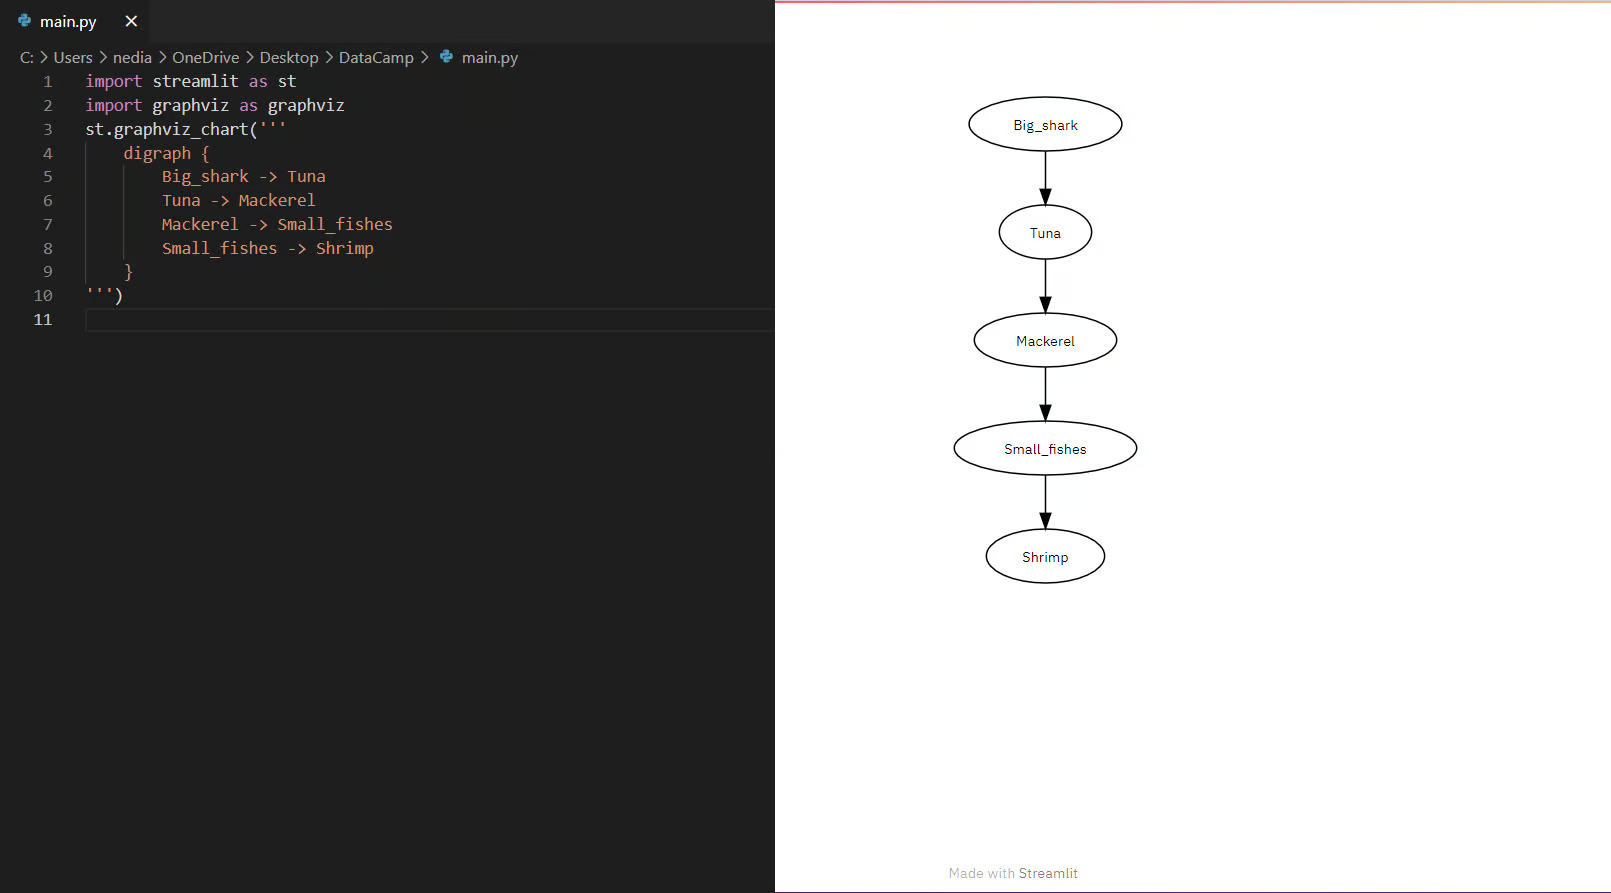
Image Source: https://www.datacamp.com/tutorial/streamlit
2. 지도 출력
- Streamlit은 간단한
st.map()함수를 이용하여 지도를 표시할 수 있으며,latitude(위도) 및longitude(경도) 데이터를 기반으로 시각화할 수 있습니다.
지도 출력 (st.map())
-
설명: Pandas 데이터프레임에 위도(lat)와 경도(lon) 값을 포함하여 지도를 출력할 수 있습니다.
- 지리적 데이터 시각화를 위한 기본적인 지도 기능을 제공합니다.
- 위도(
lat)와 경도(lon) 값이 포함된 데이터가 필요합니다.
-
예제:
  import pandas as pd
  import numpy as np
  import streamlit as st

  df = pd.DataFrame(
      np.random.randn(500, 2) / [50, 50] + [37.76, -122.4],  # 샌프란시스코 주변 랜덤 좌표 생성
      columns=['lat', 'lon']
  )
  st.map(df)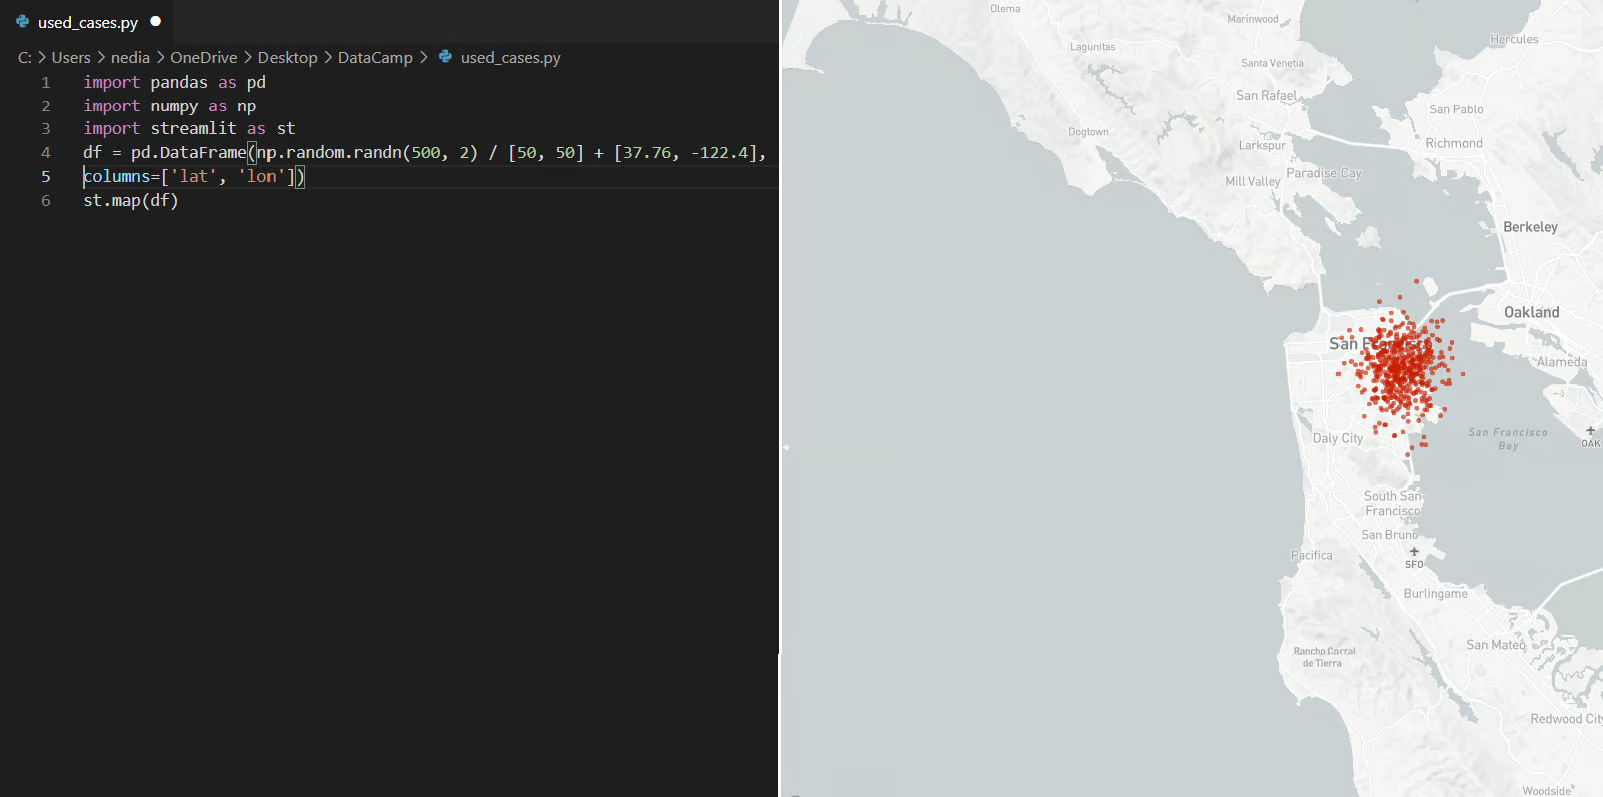
Image Source: https://www.datacamp.com/tutorial/streamlit
📌 4.6. 상태 메시지 및 진행률 표시
- Streamlit은 애플리케이션의 현재 상태를 시각적으로 표현할 수 있는 다양한 기능을 제공합니다. 진행률 바, 스피너(로딩 표시), 알림 메시지 등을 활용하여 사용자 경험을 향상시킬 수 있습니다.
1. 진행률 및 로딩 상태 표시
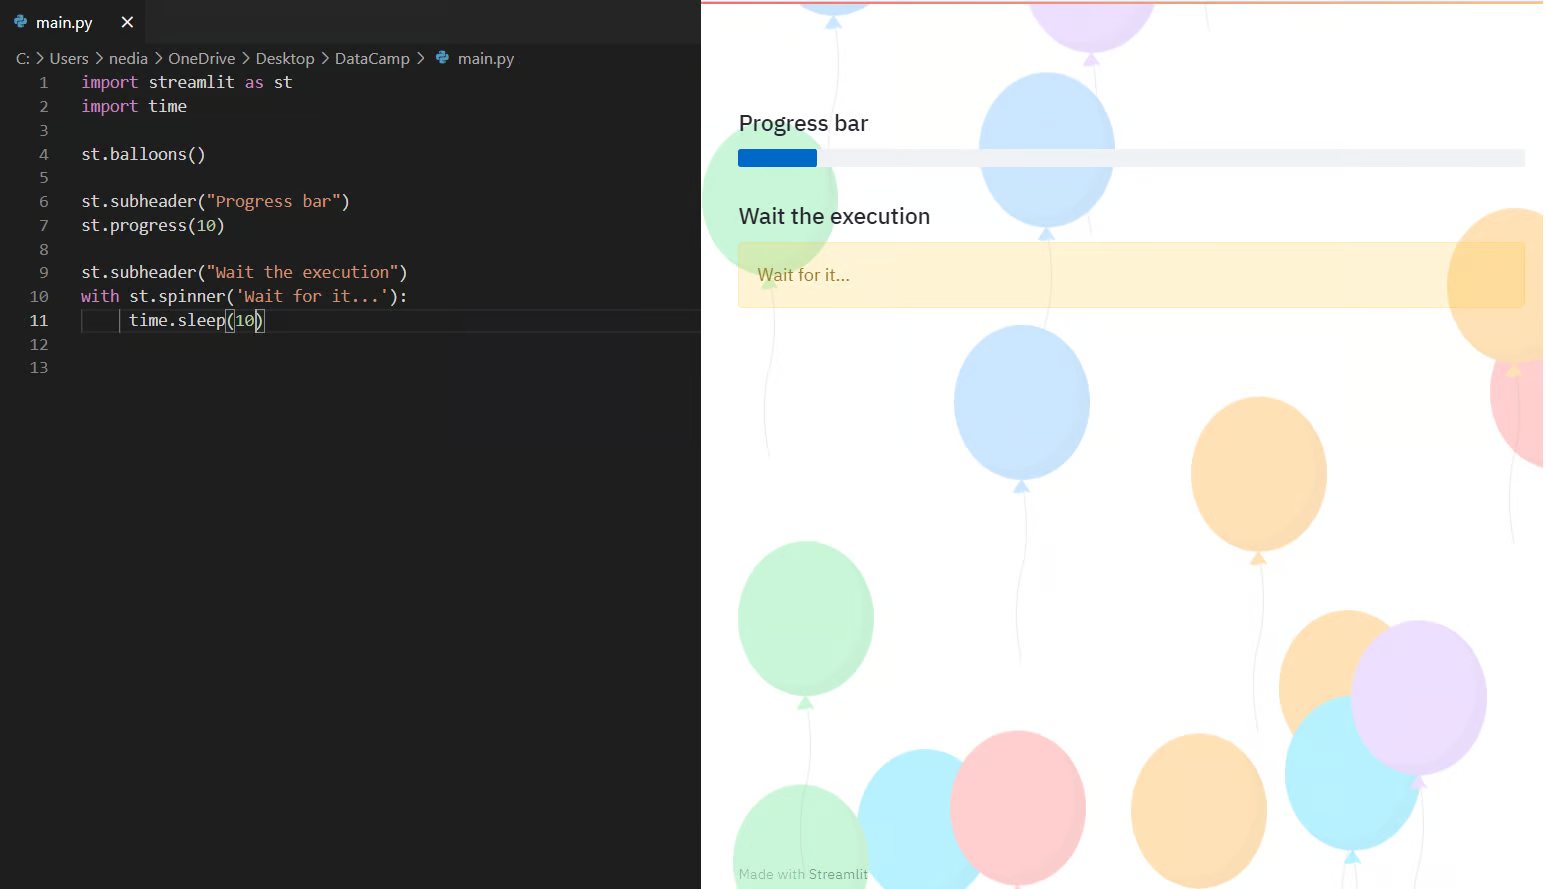
Image Source: https://www.datacamp.com/tutorial/streamlit
(1) 진행률 바 (st.progress())
-
설명: 프로세스 진행 상황을 나타내는 진행률 바(progress bar) 를 생성할 수 있습니다.
-
예제:
  import streamlit as st
  import time

  progress_bar = st.progress(0)  # 초기값 0

  for percent in range(0, 101, 10):
      time.sleep(0.1)  # 프로세스 진행 시뮬레이션
      progress_bar.progress(percent)  # 진행률 업데이트
(2) 스피너 (st.spinner())
-
설명: 시간이 걸리는 작업 중 로딩 메시지를 표시하는 기능입니다.
-
예제:
  import streamlit as st
  import time

  with st.spinner("잠시만 기다려 주세요..."):
      time.sleep(5)  # 대기 시간 시뮬레이션
  st.success("작업 완료!")
(3) 축하 애니메이션 (st.balloons())
-
설명: 사용자가 작업을 완료했을 때 풍선 애니메이션을 표시하여 축하할 수 있습니다.
-
예제:
  import streamlit as st

  st.success("작업이 성공적으로 완료되었습니다!")
  st.balloons()  # 축하 애니메이션
2. 상태 메시지 출력
- Streamlit은 성공, 오류, 경고, 정보 메시지를 쉽게 출력할 수 있습니다.
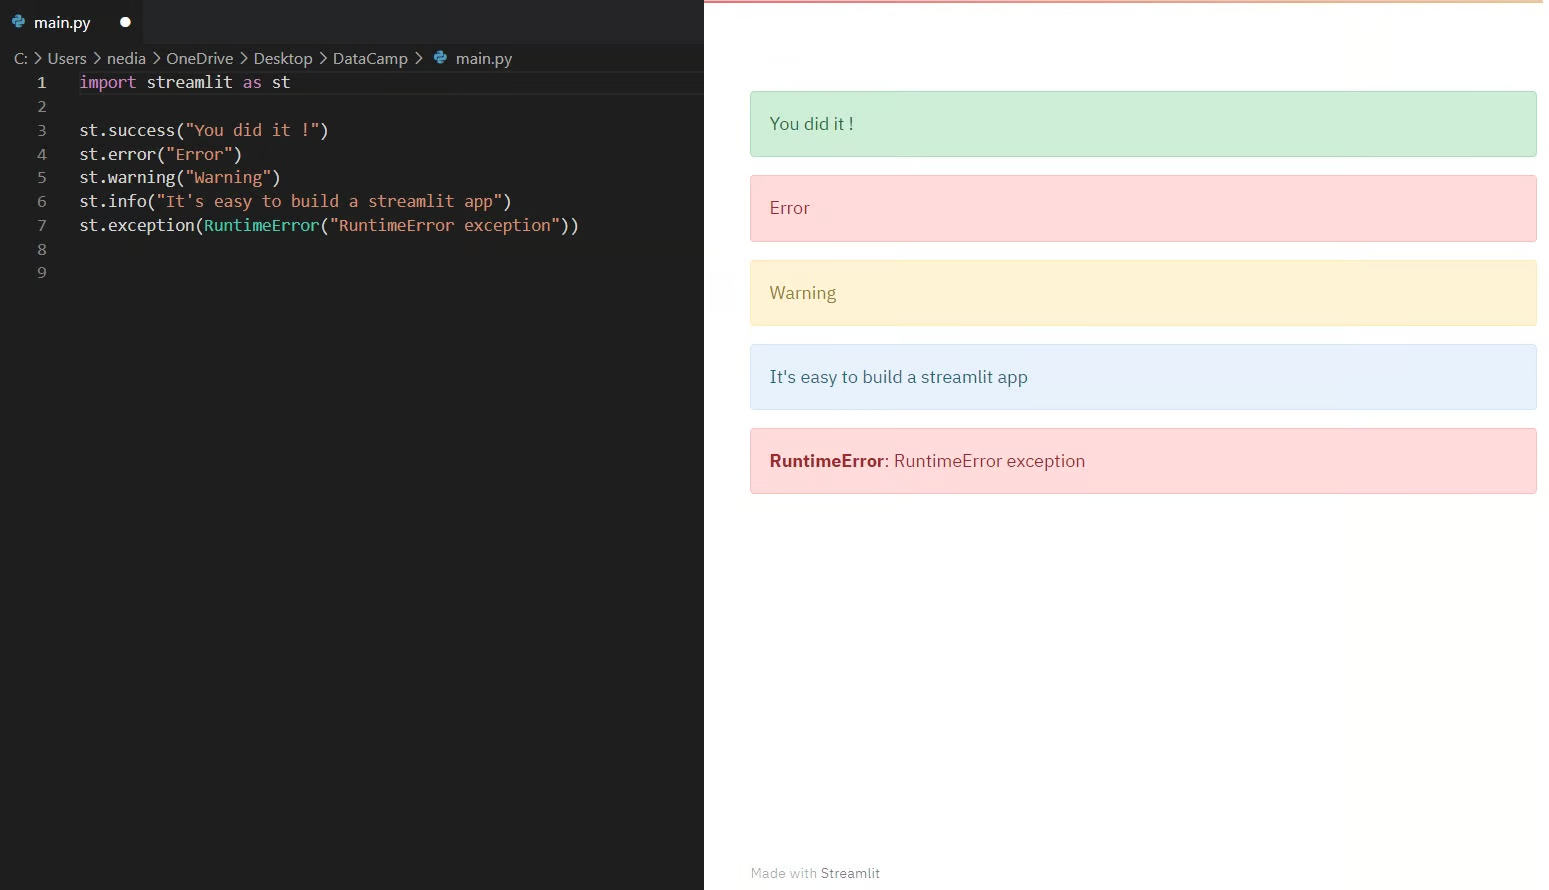
Image Source: https://www.datacamp.com/tutorial/streamlit
(1) 성공 메시지 (st.success())
- 설명: 성공적인 작업 완료를 알리는 녹색 메시지를 출력합니다.
- 예제:
st.success("축하합니다! 모든 작업이 성공적으로 완료되었습니다.")(2) 오류 메시지 (st.error())
- 설명: 에러 또는 실패한 작업을 강조할 때 사용합니다.
- 예제:
st.error("오류가 발생했습니다. 다시 시도해주세요.")(3) 경고 메시지 (st.warning())
- 설명: 주의가 필요한 작업을 강조하는 경고 메시지입니다.
- 예제:
st.warning("이 작업은 주의가 필요합니다.")(4) 정보 메시지 (st.info())
- 설명: 일반적인 정보나 가이드라인을 전달할 때 사용됩니다.
- 예제:
st.info("Streamlit을 사용하면 쉽게 웹 앱을 만들 수 있습니다.")(5) 예외 메시지 (st.exception())
- 설명: Python의 예외(Exception) 를 출력할 때 사용합니다.
- 예제:
st.exception(RuntimeError("RuntimeError 예외 발생"))5. Streamlit Component
Streamlit은 다양한 UI 요소를 제공하여 애플리케이션을 보다 구조적으로 정리하고 사용자 경험을 향상시킬 수 있습니다. 이 장에서는 사이드바, 컨테이너, 컬럼, 탭, 익스팬더(expander) 등의 기능을 정리하겠습니다.
📌 5.1. Sidebar 사용하기
Streamlit의 st.sidebar()를 사용하면 화면의 왼쪽에 고정된 사이드바(Sidebar) 를 만들 수 있습니다.
(1) 사이드바 기본 사용법
-
설명:
st.sidebar를 사용하면 앱의 주요 콘텐츠를 방해하지 않고 옵션, 입력 필드, 버튼 등을 배치할 수 있습니다. -
예제:
  import streamlit as st

  st.sidebar.title("사이드바 메뉴")
  st.sidebar.markdown("여기에 설정을 추가할 수 있습니다.")

  # 사이드바 요소 추가
  option = st.sidebar.radio("옵션 선택", ["옵션 A", "옵션 B", "옵션 C"])
  st.sidebar.button("사이드바 버튼")
📌 주요 특징
st.sidebar.title(),st.sidebar.markdown(),st.sidebar.radio()등을 사용하여 사이드바 내 UI 구성 가능- 주요 콘텐츠를 화면 중앙에 배치하면서 설정을 사이드바에 넣어 사용자 경험을 향상
📌 5.2. 여러 개의 컬럼 활용
Streamlit에서는 st.columns()을 사용하여 여러 개의 컬럼을 생성할 수 있습니다. 이를 활용하면 레이아웃을 더 정돈할 수 있습니다.
(1) 동일한 너비의 컬럼 생성
-
설명:
st.columns(n)을 사용하면n개의 동일한 크기의 컬럼이 생성됩니다. -
예제:
  col1, col2 = st.columns(2)

  col1.write("첫 번째 컬럼")
  col2.write("두 번째 컬럼")
(2) 다양한 너비의 컬럼 생성
-
설명:
st.columns([비율1, 비율2, ...])을 사용하면 비율을 지정하여 가변적인 너비의 컬럼을 생성할 수 있습니다. -
예제:
  col1, col2, col3 = st.columns([2, 6, 2])

  with col1:
      st.header('Col1')
      st.image('https://static.streamlit.io/examples/cat.jpg')

  with col2:
      st.header('Col2')
      st.image('https://static.streamlit.io/examples/dog.jpg')

  with col3:
      st.header('Col3')
      st.image('https://static.streamlit.io/examples/owl.jpg')
📌 주요 특징
- 여러 개의 UI 요소를 병렬 배치 가능
- 데이터 시각화 및 비교 분석 화면 구성에 유용
📌 5.3. 컨테이너 사용하기
Streamlit에서는 st.container()를 사용하여 내용을 그룹화할 수 있습니다.
(1) 컨테이너 기본 사용법
-
설명:
st.container()안에 요소를 배치하면 논리적인 그룹을 만들 수 있습니다. -
예제:
  with st.container():
      st.write("이것은 컨테이너 내부입니다.")
📌 주요 특징
- 특정 콘텐츠를 논리적으로 그룹화하여 UI를 정돈
- 반복적인 UI 요소를 동적으로 생성할 때 유용
📌 5.4. Tab(탭) 활용하기
Streamlit의 st.tabs()를 사용하면 한 화면에서 여러 개의 탭을 활용할 수 있습니다.
(1) 기본적인 탭 생성
-
설명:
st.tabs(["탭 이름1", "탭 이름2", ...])을 사용하여 탭을 생성하고, 각 탭에 콘텐츠를 추가할 수 있습니다. -
예제:
  tab1, tab2, tab3 = st.tabs(['Cat', 'Dog', 'Owl'])

  with tab1:
      st.header('고양이')
      st.image('https://static.streamlit.io/examples/cat.jpg')

  with tab2:
      st.header('강아지')
      st.image('https://static.streamlit.io/examples/dog.jpg')

  with tab3:
      st.header('올빼미')
      st.image('https://static.streamlit.io/examples/owl.jpg')
📌 주요 특징
- 여러 개의 정보를 한 화면에서 관리하면서도 사용자가 선택적으로 볼 수 있도록 구성
- 멀티 페이지 구조를 효과적으로 구현 가능
📌 5.5. Expander(펼치기) 사용하기
Streamlit에서는 st.expander()를 사용하여 정보를 접고 펼치는 UI를 구현할 수 있습니다.
(1) 기본적인 Expander 사용법
-
설명:
st.expander("제목")을 사용하여 기본적으로 접혀 있는 블록을 만들고, 클릭 시 내용을 펼칠 수 있습니다. -
예제:
  with st.expander("더 보기"):
      st.write("이곳에 추가 정보를 입력할 수 있습니다.")
(2) Expander 내부에 이미지 및 텍스트 추가
-
설명:
st.expander()내부에 여러 가지 요소를 넣을 수 있습니다. -
예제:
  with st.expander("고양이 정보 보기"):
      st.write("여기에는 고양이에 대한 정보가 들어갑니다.")
      st.image('https://static.streamlit.io/examples/cat.jpg', width=200)
📌 주요 특징
- 긴 내용을 한 번에 표시하지 않고, 필요할 때만 내용을 볼 수 있도록 구성 가능
- 설명서, 추가 정보 제공 시 유용
6. Streamlit 로컬 서버 실행 및 외부 접속 설정
(참고) 기본적으로 실행하면?
streamlit run app.py
- 기본적으로 localhost:8501 에서 실행됨.
- localhost는 127.0.0.1로 매핑되며, 외부에서는 접근할 수 없음.
- 즉, 같은 PC에서만 접근 가능하고, 다른 네트워크 기기(예: 스마트폰, 다른 컴퓨터)에서는 접속할 수 없음.
📌 6.1 특정 포트에서 실행
- 기본 포트(8501) 대신
8080포트에서 실행됨.
streamlit run app.py --server.port 8080✅ 왜 특정 포트를 변경할까?
- 포트 충돌 방지: 이미 8501 포트를 다른 서비스가 사용 중일 수도 있음.
- 기본 방화벽 정책 우회: 일부 네트워크 환경에서는 특정 포트(예: 8501)가 차단될 수 있음.
- 공유된 서버에서 다른 서비스와 구분: 동일한 서버에서 여러 Streamlit 앱을 실행할 때 포트를 다르게 설정해야 함.
📌 6.2 외부 네트워크에서 접속 가능하게 하기
- 같은 네트워크 내 다른 기기에서도
http://<서버 IP>:8080으로 접속 가능
streamlit run app.py --server.address 0.0.0.0 --server.port 8080✅ 여기서 0.0.0.0이 무엇인가?
- 기본적으로 Streamlit은
localhost(127.0.0.1)에서만 실행되므로, 외부에서는 접근할 수 없음.0.0.0.0으로 설정하면 해당 컴퓨터의 모든 네트워크 인터페이스에서 접근 가능.- 즉, 같은 네트워크의 다른 기기에서도
http://<서버의 IP>:8080을 통해 접근 가능.
7. Streamlit 배포하기
📌 7.1 Streamlit Community Cloud 배포
- GitHub에 프로젝트 업로드
- Streamlit Cloud 접속
- New app 버튼 클릭 후 GitHub 저장소 선택
- 자동으로 배포됨 (무료 배포 가능)
📌 7.2 Docker를 활용한 배포
1) Dockerfile 작성
FROM python:3.9

WORKDIR /app
COPY requirements.txt .
RUN pip install -r requirements.txt
COPY . .

CMD ["streamlit", "run", "app.py", "--server.address=0.0.0.0", "--server.port=8501"]
2) Docker 컨테이너 실행
docker build -t my-streamlit-app .
docker run -p 8501:8501 my-streamlit-app
🚀 이제 http://<서버 IP>:8501에서 접근 가능!
ℹ️ Streamlit 커뮤니티 및 학습 자료
- Streamlit 공식 문서: https://docs.streamlit.io/
- 30일 챌린지: https://30days.streamlit.app
- Streamlit 갤러리 (예제 앱 모음): https://streamlit.io/gallery
- Streamlit 포럼 (질문 & 토론): https://discuss.streamlit.io
🎯 정리
Streamlit은 간단한 파이썬 코드만으로 웹/앱 대시보드를 만들 수 있는 최고의 도구- 배포도 쉽고, 로컬 서버에서도 손쉽게 실행 가능
- 데이터 분석, 머신러닝 모델 배포, 실시간 대시보드 구축 등 다양한 분야에서 활용 가능
읽어주셔서 감사합니다 👑