
구축 방법
Grafana 설치
yum repository 설정
$ vi /etc/yum.repos.d/grafana.repo
[grafana]
name=grafana
baseurl=https://packages.grafana.com/enterprise/rpm
repo_gpgcheck=1
enabled=1
gpgcheck=1
gpgkey=https://packages.grafana.com/gpg.key
sslverify=1
sslcacert=/etc/pki/tls/certs/ca-bundle.crt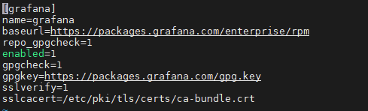
Grafana 설치
$ sudo yum -y install grafana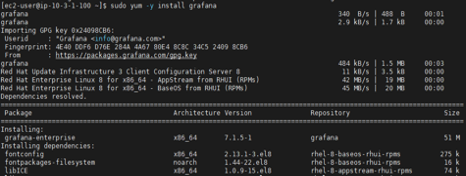
서비스 설정 및 시작
$ sudo systemctl daemon-reload
$ sudo systemctl enable grafana-server
$ sudo systemctl restart grafana-server
$ netstat -nltp | grep 3000
$ ps -ef | grep grafana-server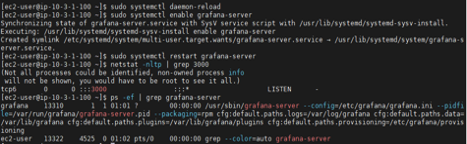
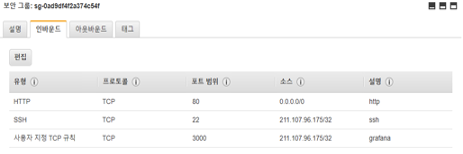
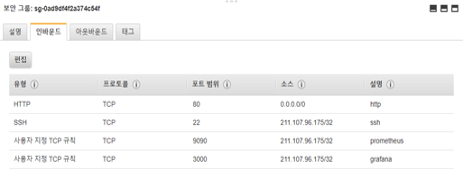
AWS 보안그룹 설정
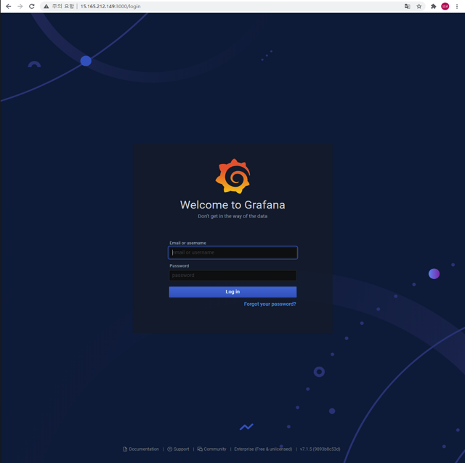
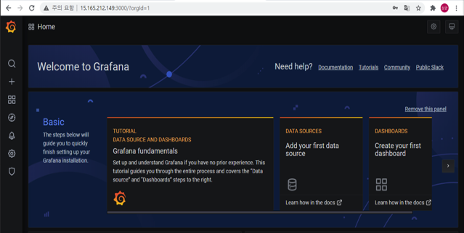
Grafana 접속
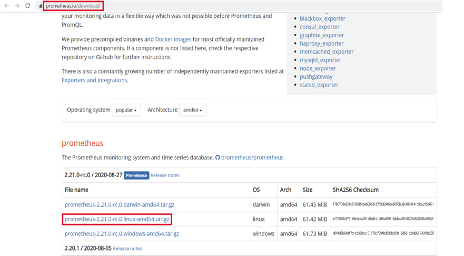
Prometheus 설치
link 복사 후 wget 사용 파일 다운로드
압축 해제 및 실행
$ tar -xvzf Prometheus-2.21.0-rc.linux-amd64.tar.gz
$ ./prometheus --config.file=prometheus.yml
AWS 보안그룹 설정
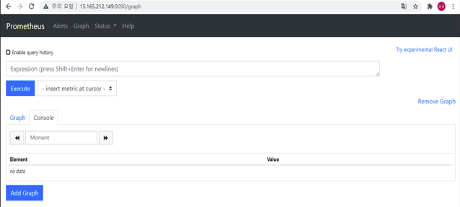
Prometheus 접속
Grafana Data Source Prometheus 설정
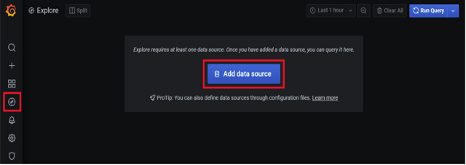
Explore / Add data source 클릭
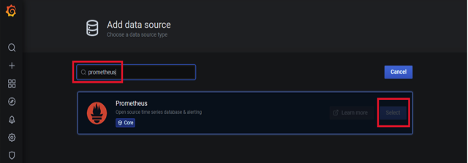
Prometheus 검색 및 추가
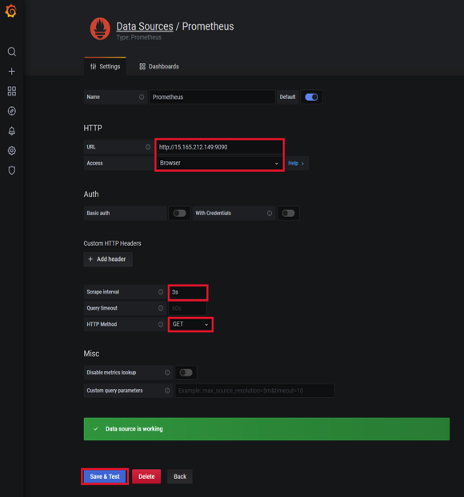
Prometheus 설정
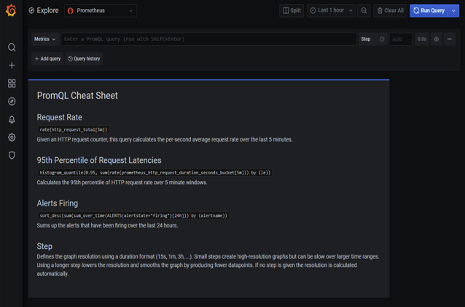
Grafana & Prometheus 연동 확인
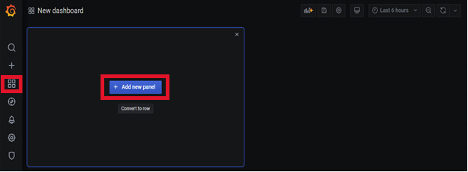
Dashboard 패널 생성
패널 생성
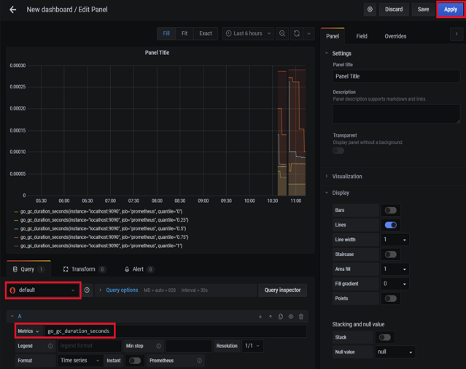
패널 쿼리 추가 및 Metric 설정
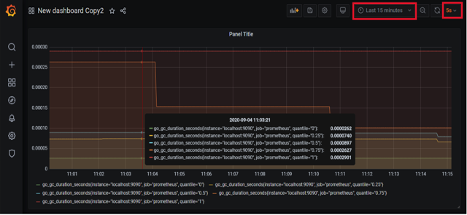
시각화 패널 Metric 확인
CPU 부하 테스트 및 모니터링 지표 확인
$ dd if=/dev/urandom | gzip --best >> /dev/null &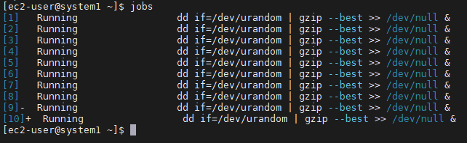
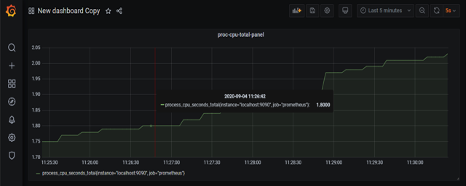
Grafana Dashboard 지표 확인 (별도 구성)
Cloud Engineer@ 클라우드 상에서 엔지니어링을 재미있게 하는 엔지니어입니다.