Overview
클라이언트와 REST 방식으로 통신하는 API 개발을 할 때, 백엔드 개발자는 처음부터 클라이언트의 모든 변수를 예상하기가 어렵습니다. 백엔드 개발자는 보통 다음과 같은 방법으로 클라이언트의 API 기능을 명세합니다.
- Rest Docs, Swagger 혹은 직접 작성한 API 문서를 만들어 요청/응답 값의 필드명과 제약을 명시한다.
- Bean Validation 등의 유효성검사를 통해 Controller 계층에서 필드를 검증하고 응답 에러 코드를 내려준다.
- 로직에서 유효하지 않는 값이 들어오면 Custom Exception을 발생시키고 클라이언트에게 적절한 에러 코드와 메시지를 내려준다.
또한 위와 같은 내용을 테스트 코드를 통해 검증하고 에러를 최소화합니다. 하지만 개발을 하며 기능이나 요청/응답 값의 변화가 필요한 경우가 많습니다. 그래서 결국 예상치 못한 에러가 클라이언트 개발시, 혹은 운영시에 발생할 수 밖에 없습니다.
더 나아가 서버와 서버가 서로 통신하는 경우나 오픈 API로 개발하여 파트너사와 통신하는 경우는 어떻게 해야할까요? 인하우스 클라이언트 개발자가 아니면 요청/응답 값의 정확한 데이터를 파악하기 힘들고 해외의 파트너사가 운영하는 경우 영업시간이 달라 커뮤니케이션이 상당히 어렵습니다.
이런 경우 서버 개발자는 request와 response를 하나의 pair로 묶어 여기서 필요한 정보를 로깅을 합니다. 이 둘을 묶어주는 trace_id를 통해 요청 및 응답 로그를 찾아서 어떤 요청이 올 때 어떤 응답이 내려가는지 데이터를 쉽게 모니터링할 수 있습니다. 또한 더 나아가 MSA 구조에서는 해당 요청을 하나의 트랜잭션으로 관리하여 트랜잭션을 식별하고 이를 추적할 수 있는 식별자로 사용할 수도 있습니다.
이번 글에서는 API 서버에 요청이 올 때 요청한 내용과 응답되는 내용을 모니터링하는 시스템을 구축하는 방법을 알아보았습니다. 이 시스템을 구축하기 위해서 다음 기술을 사용했습니다.
환경
- Kotlin 1.7
- jdk 17
- Spring Boot 2.7.x
로깅
- slf4j Logger
- Filter
- Spring Boot AOP
- Spring Logback
모니터링
- Filebeat
- Logstash
- ElasticSearch
- Kibana
샘플 예제 코드
서버 요청/응답 데이터 로깅
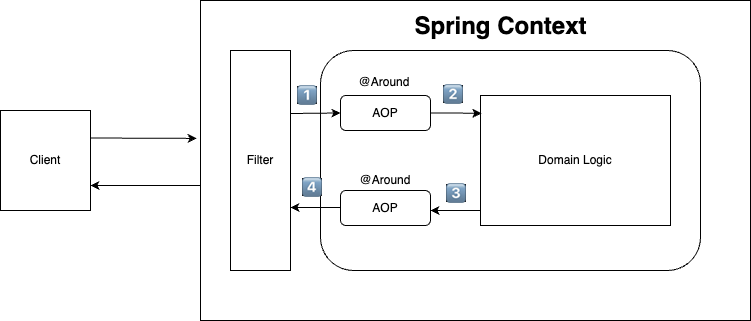
저는 애플리케이션 내에서는 위와 같은 로직을 사용해서 로깅을 하려고 합니다.
- filter를 사용해서 Spring Context에 들어가기전에 trace_id를 생성하고 request body를 캐싱하는 객체로 전환해서 전달해줍니다.
- 엔드포인트에 도달하기 전에 에러가 발생하면 trace_id 생성을 못할 수 있어 가장 앞단의 필터에서 생성해줍니다.
- http servlet request body는 한 번만 읽을 수 있기 때문에 convert를 해줘야합니다. 아래에서 설명합니다.
- aop를 통해 도달한 조인포인트의 정보(class, method)를 기록합니다.
- aop를 통해 조인포인트의 response이나 에러 정보, 경과시간 등을 기록합니다.
- 에러 발생시 trace_id를 포함한 에러코드를 내려줍니다. exception handling이 되지 않은 에러는 stack trace가 노출되기 때문에 가장 앞단의 필터에서 예외를 잡아주어야 합니다.
Use Case
@RestController
@RequestMapping("/api")
class SampleController {

    @GetMapping("/sample")
    fun sample(@RequestBody sampleRequest: SampleRequest): ResponseEntity<*> {
        return ResponseEntity.ok(SampleResponse(status = "OK", date = LocalDateTime.now()))
    }

    @GetMapping("/exception")
    fun exception(): ResponseEntity<*> {
        throw RuntimeException("런타임 에러")
    }
}

data class SampleRequest(
    val name: String,
    val number: Int
)

data class SampleResponse(
    val status: String,
    val date: LocalDateTime
)
간단하게 2가지 케이스를 확인해보려고 합니다.
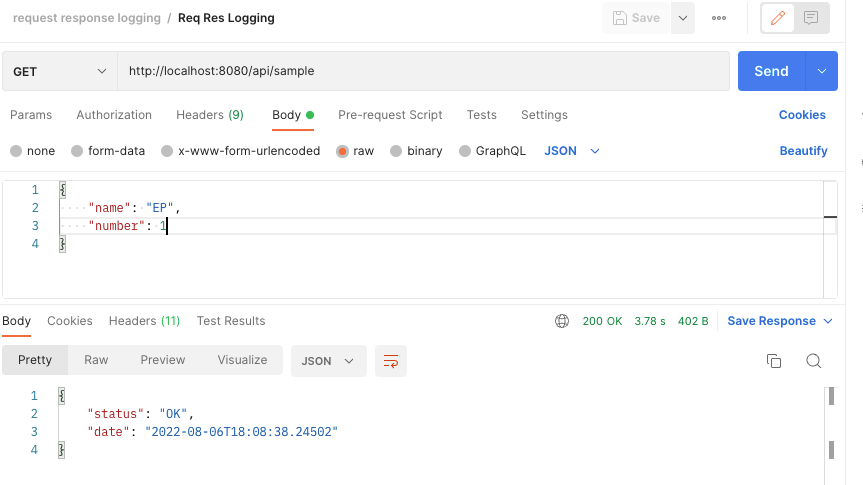
Success Case
/api/sample에 정상적으로 요청을 하여 여러 Request 정보를 포함하여 QueryString, RequestBody가 제대로 로깅이 되는지 확인합니다.
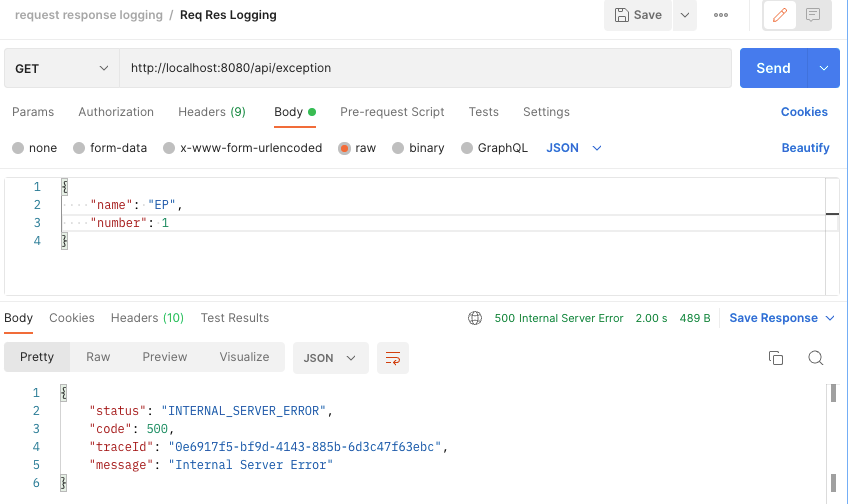
Fail Case
/api/exception 에 요청을 하였을 때, 예상하지못한 RuntimeException이 발생했을 때, 클라이언트가 trace_id를 확인할 수 있는지 확인합니다.
로깅 데이터
우리는 로깅을 통해 다음 정보를 받아보려고 합니다.
- trace_id: request, response를 pair로 묶는 uuid
- request 기본 정보: uri, http method, request server ip, device type
- 서버 비즈니스 로직 정보: controller, method
- 요청 데이터: query parameter, request body
- 응답 데이터: response body, 응답 경과 시간
data class ReqResLogging(
    @JsonProperty(value = "traceId")
    val traceId: String,
    @JsonProperty(value = "class")
    val className: String? = null,
    @JsonProperty(value = "http_method")
    val httpMethod: String? = null,
    @JsonProperty(value = "uri")
    val uri: String? = null,
    @JsonProperty(value = "method")
    val method: String? = null,
    @JsonProperty(value = "params")
    val params: Map<String, Any>? = null,
    @JsonProperty(value = "log_time")
    val logTime: String,
    @JsonProperty(value = "server_ip")
    val serverIp: String? = null,
    @JsonProperty(value = "device_type")
    val deviceType: String? = null,
    @JsonProperty(value = "request_body")
    val requestBody: Any? = null,
    @JsonProperty(value = "response_body")
    val responseBody: Any? = null,
    @JsonProperty(value = "elapsed_time")
    val elapsedTime: String? = null
)
이를 더해 예기치 못한 런타임 예외가 발생했을 때, 응답에 trace_id를 같이 내려주려고 합니다. 로깅을 위해서 저는 Filter와 Spring AOP를 사용해서 데이터를 저장하려고 합니다.
Request 정보 저장
HttpServletRequest에 대해서는 다들 이해도가 있으실거라 생각합니다. 이 객체에서 요청정보를 모든 요청에서 꺼내서 데이터를 저장하면 됩니다. 하지만 실제로 컨트롤러에 요청이 도달하기 전에 request body의 정보를 읽으면 문제가 발생하는데요. 이유는 요청 body에 있는 정보는 오직 단 한 번만 읽을 수 있기 때문입니다.
HttpServletRequest.inputStream 가 오직 한 번만 읽을 수 있는 이유
서블릿 요청 및 응답의 바디는 ServletInputStream으로 구현이 됩니다. 이 객체는 InputStream에서 상속이 되었습니다.
public abstract class ServletInputStream extends InputStream {

    protected ServletInputStream() {
        // NOOP
    }
    public int readLine(byte[] b, int off, int len) throws IOException {

        if (len <= 0) {
            return 0;
        }
        int count = 0, c;

        while ((c = read()) != -1) {
            b[off++] = (byte) c;
            count++;
            if (c == '\n' || count == len) {
                break;
            }
        }
        return count > 0 ? count : -1;
    }

    public abstract boolean isFinished();

    public abstract boolean isReady();

    public abstract void setReadListener(ReadListener listener);
}InputStream은 데이터를 read() 메서드를 통해 데이터를 가져오고 끝까지 읽으면 읽기 완료를 나타냅니다. 또한 이 데이터를 다시 읽으려면 reset()이라는 메서드를 호출해야 합니다. 하지만 ServletInputStream는 위 코드와 같이 reset() 메서드를 오버라이드 하지 않았습니다. 하지만 상속관계니깐 InputStream을 그대로 호출하면 될까요? 그렇지 않습니다.
/**
     * Repositions this stream to the position at the time the
     * {@code mark} method was last called on this input stream.
     *
     * <p> The general contract of {@code reset} is:
     *
     * <ul>
     * <li> If the method {@code markSupported} returns
     * {@code true}, then:
     *
     *     <ul><li> If the method {@code mark} has not been called since
     *     the stream was created, or the number of bytes read from the stream
     *     since {@code mark} was last called is larger than the argument
     *     to {@code mark} at that last call, then an
     *     {@code IOException} might be thrown.
     *
     *     <li> If such an {@code IOException} is not thrown, then the
     *     stream is reset to a state such that all the bytes read since the
     *     most recent call to {@code mark} (or since the start of the
     *     file, if {@code mark} has not been called) will be resupplied
     *     to subsequent callers of the {@code read} method, followed by
     *     any bytes that otherwise would have been the next input data as of
     *     the time of the call to {@code reset}. </ul>
     *
     * <li> If the method {@code markSupported} returns
     * {@code false}, then:
     *
     *     <ul><li> The call to {@code reset} may throw an
     *     {@code IOException}.
     *
     *     <li> If an {@code IOException} is not thrown, then the stream
     *     is reset to a fixed state that depends on the particular type of the
     *     input stream and how it was created. The bytes that will be supplied
     *     to subsequent callers of the {@code read} method depend on the
     *     particular type of the input stream. </ul></ul>
     *
     * <p>The method {@code reset} for class {@code InputStream}
     * does nothing except throw an {@code IOException}.
     *
     * @throws  IOException  if this stream has not been marked or if the
     *          mark has been invalidated.
     * @see     java.io.InputStream#mark(int)
     * @see     java.io.IOException
     */
    public synchronized void reset() throws IOException {
        throw new IOException("mark/reset not supported");
    }

    /**
     * Tests if this input stream supports the {@code mark} and
     * {@code reset} methods. Whether or not {@code mark} and
     * {@code reset} are supported is an invariant property of a
     * particular input stream instance. The {@code markSupported} method
     * of {@code InputStream} returns {@code false}.
     *
     * @return  {@code true} if this stream instance supports the mark
     *          and reset methods; {@code false} otherwise.
     * @see     java.io.InputStream#mark(int)
     * @see     java.io.InputStream#reset()
     */
    public boolean markSupported() {
        return false;
}reset()을 오버라이딩하지 않고 호출하면 예외가 발생하게 됩니다. 따라서 reset()을 사용하기 위해서는 reset()을 재정의해야하고 markSupported를 true로 반환하게 하도록 해야합니다. 하지만 HttpServletRequest는 이를 오버라이딩하지 않았으니 오직 한 번만 읽을 수 있는 InputStream을 제공하는 것입니다.
ContentCachingRequestWrapper
흔히 request body를 두 번 이상 읽는 방법을 검색하면 ContentCachingRequestWrapper 객체를 사용하라는 내용의 글이 많이 나옵니다. 하지만 이 객체는 제한사항이 있습니다. 이 객체는 요청 바디를 실제로 한 번 읽어야지 그 데이터를 캐싱해서 사용한다는 점입니다. reuqest가 실제 Spring Context 안에서 실행이 되야 캐싱처리를 하기 때문에 doFilter 이후에 처리를 할 수 있는 것 입니다.
따라서 필터의 후처리에만 작동을 하기 때문에 인터셉터나 예외처리 사용이 어려울 수 있습니다. 이를 해결하기 위해 새로운 Custom Request Wapper 객체를 만들어서 해결했습니다.
class CachedBodyHttpServletRequest(request: HttpServletRequest) : HttpServletRequestWrapper(request) {

    private val cachedBody: ByteArray

    init {
        val requestInputStream = request.inputStream
        this.cachedBody = StreamUtils.copyToByteArray(requestInputStream)
    }

    override fun getInputStream(): ServletInputStream {
        return CachedBodyServletInputStream(this.cachedBody)
    }
}

class CachedBodyServletInputStream(cachedBody: ByteArray) : ServletInputStream() {

    private val cachedBodyInputStream: InputStream

    init {
        this.cachedBodyInputStream = ByteArrayInputStream(cachedBody)
    }

    override fun read(): Int = cachedBodyInputStream.read()

    override fun isFinished(): Boolean = cachedBodyInputStream.available() == 0

    override fun isReady(): Boolean = true

    override fun setReadListener(listener: ReadListener?) {
        TODO("Not yet implemented")
    }
}
아래 블로그에 자세한 내용이 작성되어있습니다.
Reading HttpServletRequest Multiple Times in Spring
request의 InputStream을 그대로 캐싱한 다음 이를 꺼내서 사용하는 방식입니다.
@Component
class ReqResFilter(
    private val objectMapper: ObjectMapper
) : OncePerRequestFilter() {

    val log = logger()

    override fun doFilterInternal(
        request: HttpServletRequest,
        response: HttpServletResponse,
        filterChain: FilterChain
    ) {
        val traceId = UUID.randomUUID().toString()
        val requestWrapper = CachedBodyHttpServletRequest(request)
        requestWrapper.setAttribute("traceId", traceId)
        filterChain.doFilter(requestWrapper, response)
    }
}
traceId를 생성하여 request attribute에 추가한뒤 다음 필터로 넘겨주었습니다.
AOP로 Reuqest / Response와 엔드포인트 정보 저장
Filter는 스프링 컨텍스트 외부에 있는 로직입니다. 따라서 해당 엔드포인트의 내용을 확인할 수 없습니다. 이 때 AOP를 사용해주면 해당 엔드포인트에 도착하여 컨트롤러 메서드가 실행되기 직전과 이후의 정보를 저장하여 에러의 위치를 디테일하게 확인할 수 있게 해줍니다. 따라서 로깅만 보고도 디테일한 코드의 위치를 확인할 수 있습니다.
@Component
@Aspect
class ApiReqResAspect(
    private val objectMapper: ObjectMapper
) {

    val log = logger()

    @Pointcut("within(com.ep.springbootlogging.api..*)")
    fun apiRestPointCut() {}

    @Around("apiRestPointCut()")
    fun reqResLogging(joinPoint: ProceedingJoinPoint): Any {
        val request = (RequestContextHolder.currentRequestAttributes() as ServletRequestAttributes).request
        val traceId = request.getAttribute("traceId") as String

        val className = joinPoint.signature.declaringTypeName // 1.
        val methodName = joinPoint.signature.name // 2.
        val params = getParams(request) // 3.

        val deviceType = request.getHeader("x-custom-device-type")
        val serverIp = InetAddress.getLocalHost().hostAddress

        val reqResLogging = ReqResLogging(
            traceId = traceId,
            className = className,
            httpMethod = request.method,
            uri = request.requestURI,
            method = methodName,
            params = params,
            logTime = LocalDateTime.now().format(DateTimeFormatter.ISO_DATE_TIME),
            serverIp = serverIp,
            deviceType = deviceType,
            requestBody = objectMapper.readTree(request.inputStream.readBytes())
        )

        val start = System.currentTimeMillis() // 4.
        try {
            val result = joinPoint.proceed() // 5.
            val elapsedTime = System.currentTimeMillis() - start
            val elapsedTimeStr = "Method: $className.$methodName() execution time: ${elapsedTime}ms"

						// 6.
            val logging = when (result) {
                is ResponseEntity<*> -> reqResLogging.copy(responseBody = result.body, elapsedTime = elapsedTimeStr)
                else -> reqResLogging.copy(responseBody = "{}")
            }
            log.info(objectMapper.writeValueAsString(logging)) // 7.
            return result
        } catch (e: Exception) {
            log.info(
                "{}",
                objectMapper.writeValueAsString(
                    reqResLogging.copy(
                        responseBody = CustomException(
                            status = HttpStatus.INTERNAL_SERVER_ERROR,
                            code = HttpStatus.INTERNAL_SERVER_ERROR.value(),
                            traceId = traceId,
                            message = "서버에 일시적인 장애가 있습니다."
                        )
                    )
                )
            )
            throw e // 8.
        }
    }

    private fun getParams(request: HttpServletRequest): Map<String, String> {
        val jsonObject = mutableMapOf<String, String>()
        val paramNames = request.parameterNames
        while (paramNames.hasMoreElements()) {
            val paramName = paramNames.nextElement()
            val replaceParam = paramName.replace("\\.", "-")
            jsonObject[replaceParam] = request.getParameter(paramName)
        }
        return jsonObject
    }
}
코드의 내용을 조금씩 확인해보겠습니다.
- 스프링 aop에서는 조인포인트 단위는 메서드만 해당합니다. 따라서 joinPoint는 해당 메서드라고 생각하면 이해하기 쉽습니다. 해당 메서드가 선언된 타입, 즉 class 이름을 뜻합니다.
- 조인포인트 시그니쳐 네임. 메서드 이름을 뜻합니다.
- query string 파라미터를 맵의 형태로 변환하는 메서드입니다.
- 메서드 진행 경과시간을 측정합니다. 외부요인을 제외하고 비즈니스 로직의 성능만을 측정하기에 좋은 방법입니다.
- 조인포인트 로직을 실행시킵니다. 반환값은 해당 메서드의 반환값입니다.
- 단, 메서드 내부적으로 예외가 발생했을 시, 그 예외를 처리하는 로직을 작성해줘야 합니다. (해당 예제에서는 예외 핸들러를 작성하지 않았지만 예외 핸들러가 ResponseEntity를 반환하는 경우 예외로 취급하지 않을 수 있습니다.)
- 코틀린에서는 프로퍼티의 값을 바꾸지 않고 새로운 객체를 만들어서 값을 변경하는 경우가 많습니다. 이 때
copy()메서드를 사용해줍니다. - 우리가 만든 request body, response body 정보가 담겨있는 객체를 로깅합니다.
- response를 여기서 직접 작성하지 않습니다. aop는 오직 로깅에만 관심이 있는 로직입니다.
Filter를 통한 예외처리
@Component
class ReqResFilter(
    private val objectMapper: ObjectMapper
) : OncePerRequestFilter() {

    val log = logger()

    override fun doFilterInternal(
        request: HttpServletRequest,
        response: HttpServletResponse,
        filterChain: FilterChain
    ) {
        val traceId = UUID.randomUUID().toString()
        try {
            val requestWrapper = CachedBodyHttpServletRequest(request)
            requestWrapper.setAttribute("traceId", traceId)
            filterChain.doFilter(requestWrapper, response)
        } catch (e: Exception) {
            log.error(e.message)
            response.contentType = MediaType.APPLICATION_JSON_VALUE
            response.status = HttpStatus.INTERNAL_SERVER_ERROR.value()
            val customException = CustomException(
                status = HttpStatus.INTERNAL_SERVER_ERROR,
                code = HttpStatus.INTERNAL_SERVER_ERROR.value(),
                traceId = traceId,
                message = "Internal Server Error"
            )
            try {
                response.writer.use {
                    it.print(objectMapper.writeValueAsString(customException))
                    it.flush()
                }
            } catch (e: IOException) {
                log.warn("IOException Occur")
                throw RuntimeException()
            }
        }
    }
}
아까 필터 내용을 조금 수정했습니다. 요청/응답 과정에서 Exception이 발생하면 Stack Trace가 노출되는 경우가 있습니다. 통상 로직상 에러는 에러 핸들러로 catch 하여 응답값에 포함시킵니다. 앞단의 필터에서 예외를 처리하게 되면 controller advice에서 잡지 못하는 controller 외부에서 발생하는 에러 내용은 로그로만 확인하고 응답값으로는 에러코드와 traceId만 내려주도록 핸들링할 수 있습니다.
테스트
/api/sample
{"traceId":"99ff015a-d26a-4d62-843d-74f7c2a58ed7","class":"com.ep.springbootlogging.api.SampleController","http_method":"GET","uri":"/api/sample","method":"sample","params":{},"log_time":"2022-08-06T18:08:37.661164","server_ip":"127.0.0.1","device_type":null,"request_body":{"name":"EP","number":1},"response_body":{"status":"OK","date":"2022-08-06T18:08:38.24502"},"elapsed_time":"Method: com.ep.springbootlogging.api.SampleController.sample() execution time: 602ms"}/api/exception
{"traceId":"0e6917f5-bf9d-4143-885b-6d3c47f63ebc","class":"com.ep.springbootlogging.api.SampleController","http_method":"GET","uri":"/api/exception","method":"exception","params":{},"log_time":"2022-08-06T18:09:35.409864","server_ip":"127.0.0.1","device_type":null,"request_body":{"name":"EP","number":1},"response_body":{"status":"INTERNAL_SERVER_ERROR","code":500,"traceId":"0e6917f5-bf9d-4143-885b-6d3c47f63ebc","message":"서버에 일시적인 장애가 있습니다."},"elapsed_time":null}에러가 나더라도 trace_id를 확인할 수 있습니다. 따라서 서버 개발자에게 해당 trace_id로 문의를 하게되면 명확한 문제의 원인을 빠르게 진단할 수 있습니다.
로그백으로 로깅 데이터 적재
로그백 설정은 간단합니다. 다음 의존성을 넣어주고
// logback
implementation("net.logstash.logback:logstash-logback-encoder:7.2")
xml을 작성해주고
logback-dev.xml
<?xml version="1.0" encoding="UTF-8"?>
<configuration>
    <property name="CONSOLE_LOG_PATTERN"
              value="%d{yyyy-MM-dd HH:mm:ss.SSS} %highlight(%-5level) %magenta(%-4relative) --- [ %thread{10} ] %cyan(%logger{20}) : %msg%n"/>
    <property name="LOG_PATH" value="./logs"/>
    <property name="FILE_NAME" value="ep-logs"/>

    <appender name="CONSOLE" class="ch.qos.logback.core.ConsoleAppender">
        <encoder class="ch.qos.logback.classic.encoder.PatternLayoutEncoder">
            <pattern>${CONSOLE_LOG_PATTERN}</pattern>
        </encoder>
    </appender>

    <appender name="FILE" class="ch.qos.logback.core.rolling.RollingFileAppender">
        <file>${LOG_PATH}/${FILE_NAME}-json.log</file>
        <encoder class="net.logstash.logback.encoder.LogstashEncoder"/>
        <rollingPolicy class="ch.qos.logback.core.rolling.TimeBasedRollingPolicy">
            <fileNamePattern>${LOG_PATH}/${FILE_NAME}_%d{yyyy-MM-dd}.%i.log</fileNamePattern>
            <maxHistory>90</maxHistory>
            <timeBasedFileNamingAndTriggeringPolicy
                    class="ch.qos.logback.core.rolling.SizeAndTimeBasedFNATP">
                <maxFileSize>10MB</maxFileSize>
            </timeBasedFileNamingAndTriggeringPolicy>
        </rollingPolicy>
    </appender>

    <root level = "INFO">
        <appender-ref ref="FILE"/>
        <appender-ref ref="CONSOLE"/>
    </root>
</configuration>
application-dev.properties
logging.level.com.ep.springbootlogging=info
logging.config=classpath:logback-${spring.profiles.active}.xml
profile 환경을 ‘dev’로 설정한뒤 다시 테스트를 하면 다음과 같은 로그 파일이 생성됩니다.
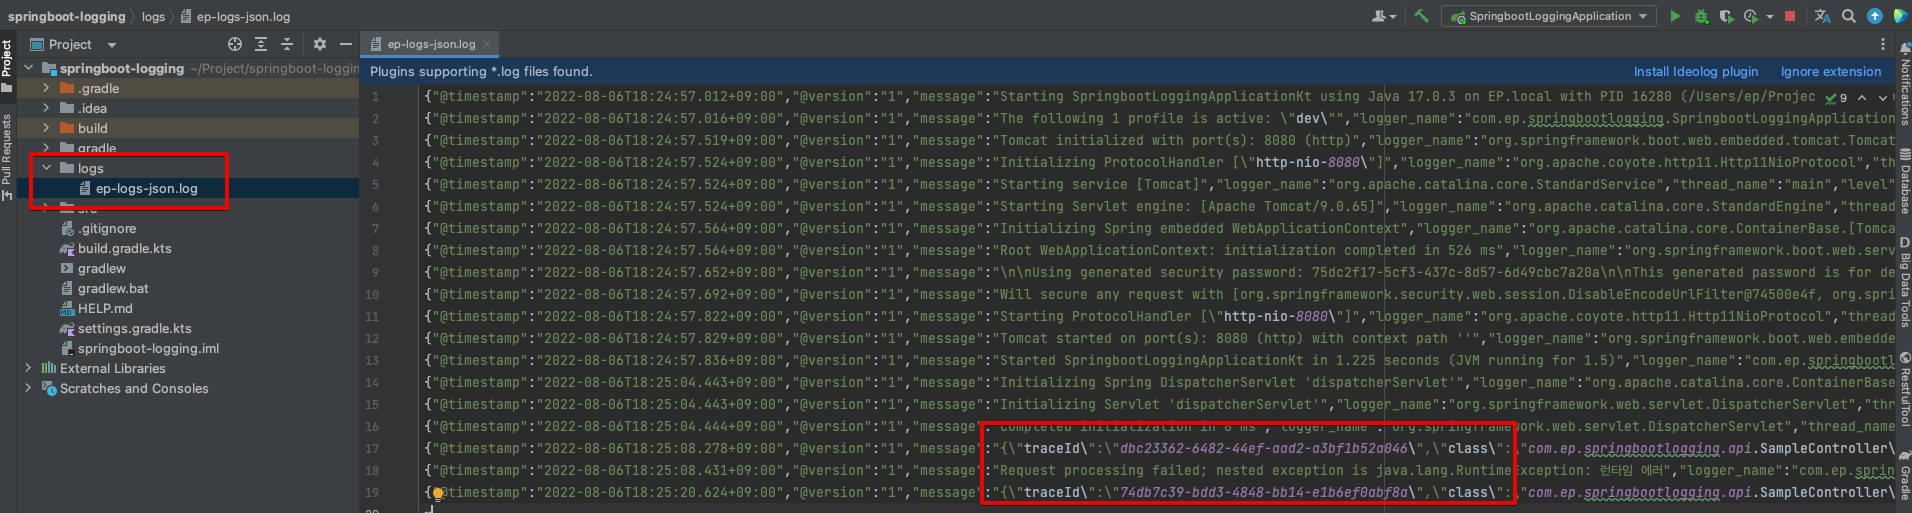
로그 파일이 생성되는 것만으로도 로깅 모니터링을 할 수 있습니다.
tail -f {파일명}.log
입력하면 로그 파일의 변경되는 사항을 실시간으로 확인할 수 있습니다. 하지만 일일이 서버에 접속해서 로그 파일을 모니터링할 수는 없을 겁니다. 더군다나 서버의 인스턴스가 여러개로 확장되면 같은 프로젝트라고 해도 로그파일이 분산되어있을 겁니다. 그래서 여러 인스턴스에 파편화되어있는 로그파일의 정보를 하나의 저장소로 적재하고 시각화해야지 정보를 쉽게 파악할 수 있습니다.
ELK 스택
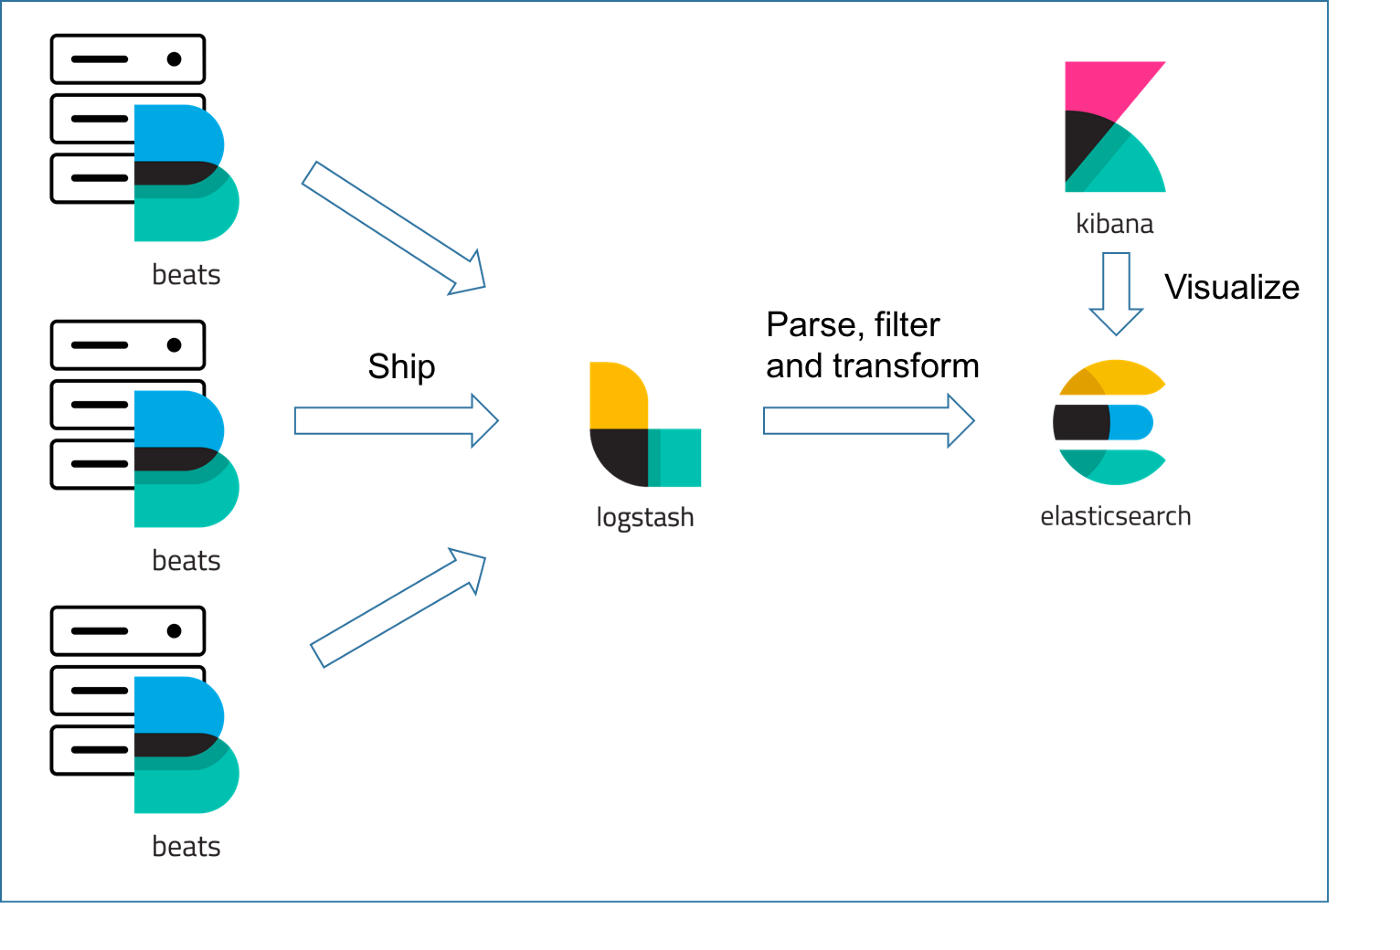
ELK 스택은 앞서 말한 문제를 해결하기 위해 사용할 수 있는 툴입니다. 해당 글에서 사용할 기능을 간단하게 설명하겠습니다.
파일비트(beats)가 서버에 있는 로그 파일을 읽어내 변경사항을 감시합니다. 변경사항이 있는 내용을 주기적으로 로그 스태시에 발송을 합니다. 여러 인스턴스에 있는 파일비트는 단일한 로그스태시로 정보를 발송하게 되고 로그스태시는 그 내용을 필터 및 정제해서 데이터를 엘라스틱 서치로 적재합니다. 엘라스틱서치는 정보를 json의 형태로 적재하여 저장된 로깅 데이터를 검색할 수 있는 기능을 Query DSL의 형식으로 제공합니다. 키바나는 엘라스틱 서치에 적재된 데이터를 조금 더 간편하게 확인할 수 있고 이 데이터를 시각화해서 보여주는 역할을 하게됩니다.
그런데 사실 이 모든 과정을 직접 설치하는 것은 가볍게 로직을 확인하기에 꽤나 번거로울 것입니다. 그래서 이 글에서는 logstash, elasticsearch, kibana는 간편하게 Docker Compose로 설치하고 백엔드 서버 2개를 사용해서 확인해보겠습니다.
인스턴스 생성
클라우드 서버에서 elk, api 인스턴스 서버를 2개를 각각 생성해줍니다. 그리고 elk 서버는 보안규칙으로 5000포트, 9200/9300, 5601 포트를 각각 열어줍니다. 5000은 로그스태시, 9200/9300은 엘라스틱서치, 5601은 키바나 포트입니다.
Docker Compse
해당 인스턴스 OS 버전에 맞는 방법으로 docker와 docker-compose를 각각 설치해줍니다.
docker --version
docker-compose --version
그리고 git clone https://github.com/teichae/docker-elk 의 방법으로 각 docker-compos 구성요소를 설치해줍니다. docker compose config, kibana config, logstash config, elasticsearch config 입니다.
docker-compose.config
version: '2'

services:
  container_name: elasticsearch
  elasticsearch:
    build:
      context: elasticsearch/
      args:
        ELK_VERSION: $ELK_VERSION
    volumes:
      - ./elasticsearch/config/elasticsearch.yml:/usr/share/elasticsearch/config/elasticsearch.yml:ro
      - /etc/localtime:/etc/localtime:ro
    ports:
      - "9200:9200"
      - "9300:9300"
    environment:
      ES_JAVA_OPTS: "-Xmx1024m -Xms1024m"
      #ELASTIC_PASSWORD: changeme
    networks:
      - elk

  logstash:
    container_name: logstash
    build:
      context: logstash/
      args:
        ELK_VERSION: $ELK_VERSION
    volumes:
      - ./logstash/config/logstash.yml:/usr/share/logstash/config/logstash.yml:ro
      - ./logstash/pipeline:/usr/share/logstash/pipeline:ro
      - /etc/localtime:/etc/localtime:ro
    ports:
      - "5000:5000"
      - "9600:9600"
    environment:
      LS_JAVA_OPTS: "-Xmx1024m -Xms1024m"
    networks:
      - elk
    depends_on:
      - elasticsearch

  kibana:
    container_name: kibana
    build:
      context: kibana/
      args:
        ELK_VERSION: $ELK_VERSION
    volumes:
      - ./kibana/config/kibana.yml:/usr/share/kibana/config/kibana.yml:ro
      - /etc/localtime:/etc/localtime:ro
    ports:
      - "5601:5601"
    networks:
      - elk
    depends_on:
      - elasticsearch

networks:

  elk:
    driver: bridge
elasticsearch
## Default Elasticsearch configuration from Elasticsearch base image.
## https://github.com/elastic/elasticsearch/blob/master/distribution/docker/src/docker/config/elasticsearch.yml
#
cluster.name: "docker-cluster"
network.host: 0.0.0.0

## Use single node discovery in order to disable production mode and avoid bootstrap checks
## see https://www.elastic.co/guide/en/elasticsearch/reference/current/bootstrap-checks.html
#
discovery.type: single-node

## X-Pack settings
## see https://www.elastic.co/guide/en/elasticsearch/reference/current/setup-xpack.html
#
#xpack.license.self_generated.type: trial
#xpack.security.enabled: true
#xpack.monitoring.collection.enabled: true
kibana
---
## Default Kibana configuration from Kibana base image.
## https://github.com/elastic/kibana/blob/master/src/dev/build/tasks/os_packages/docker_generator/templates/kibana_yml.template.js
#
server.name: kibana
server.host: "0.0.0.0"
elasticsearch.hosts: [ "http://elasticsearch:9200" ]
#xpack.monitoring.ui.container.elasticsearch.enabled: true

## X-Pack security credentials
#
#elasticsearch.username: elastic
#elasticsearch.password: changeme
logstash.yml
## Default Logstash configuration from Logstash base image.
## https://github.com/elastic/logstash/blob/master/docker/data/logstash/config/logstash-full.yml
#
http.host: "0.0.0.0"
#xpack.monitoring.elasticsearch.hosts: [ "http://elasticsearch:9200" ]

## X-Pack security credentials
#
#xpack.monitoring.enabled: true
#xpack.monitoring.elasticsearch.username: elastic
#xpack.monitoring.elasticsearch.password: changeme
pipline/logstash.conf
input {
	beats {
		port => 5000
		host => "0.0.0.0"
		codec => json
	}
}

filter {
	mutate {
    		rename => ["host", "hostname"]
    		convert => {"hostname" => "string"}
	}
}

output {
	elasticsearch {
		hosts => "http://{host}:9200"
		index => "elk-%{+YYYY.MM.dd}"
	}
}- host에 해당하는 ip를 넣어주면 됩니다.
그리고 아래의 방법으로 도커를 실행시키고 확인하면 됩니다.
sudo docker-compose up -d
sudo docker-compose ps
sudo docker container ls
API 서버
다음은 api 서버입니다. 먼저 서버 기동을 마친 후 파일비트를 설치해줍니다.
curl -L -O https://artifacts.elastic.co/downloads/beats/filebeat/filebeat-7.12.0-amd64.deb
sudo dpkg -i filebeat-7.12.0-amd64.deb
sudo vi /etc/filebeat/filebeat.yml

// filebeat 기동
sudo nohup filebeat -e -c /etc/filebeat/filebeat.yml &
ps -ef | grep filebeat
###################### Filebeat Configuration Example #########################
# This file is an example configuration file highlighting only the most common
# options. The filebeat.reference.yml file from the same directory contains all the
# supported options with more comments. You can use it as a reference.
#
# You can find the full configuration reference here:
# https://www.elastic.co/guide/en/beats/filebeat/index.html
# For more available modules and options, please see the filebeat.reference.yml sample
# configuration file.
# ============================== Filebeat inputs ===============================
filebeat.inputs:
# Each - is an input. Most options can be set at the input level, so
# you can use different inputs for various configurations.
# Below are the input specific configurations.
- type: log
# Change to true to enable this input configuration.
enabled: true
# Paths that should be crawled and fetched. Glob based paths.
paths:
- {로그경로}/logs/*.log
#- c:\programdata\elasticsearch\logs\*
# Exclude lines. A list of regular expressions to match. It drops the lines that are
# matching any regular expression from the list.
#exclude_lines: ['^DBG']
# Include lines. A list of regular expressions to match. It exports the lines that are
# matching any regular expression from the list.
#include_lines: ['^ERR', '^WARN']
# Exclude files. A list of regular expressions to match. Filebeat drops the files that
# are matching any regular expression from the list. By default, no files are dropped.
#exclude_files: ['.gz$']
# Optional additional fields. These fields can be freely picked
# to add additional information to the crawled log files for filtering
#fields:
# level: debug
# review: 1
### Multiline options
# Multiline can be used for log messages spanning multiple lines. This is common
# for Java Stack Traces or C-Line Continuation
# The regexp Pattern that has to be matched. The example pattern matches all lines starting with [
#multiline.pattern: ^\[
# Defines if the pattern set under pattern should be negated or not. Default is false.
#multiline.negate: false
# Match can be set to "after" or "before". It is used to define if lines should be append to a pattern
# that was (not) matched before or after or as long as a pattern is not matched based on negate.
# Note: After is the equivalent to previous and before is the equivalent to to next in Logstash
#multiline.match: after
# filestream is an experimental input. It is going to replace log input in the future.
- type: filestream
# Change to true to enable this input configuration.
enabled: false
# Paths that should be crawled and fetched. Glob based paths.
paths:
- /var/log/*.log
#- c:\programdata\elasticsearch\logs\*
# Exclude lines. A list of regular expressions to match. It drops the lines that are
# matching any regular expression from the list.
#exclude_lines: ['^DBG']
# Include lines. A list of regular expressions to match. It exports the lines that are
# matching any regular expression from the list.
#include_lines: ['^ERR', '^WARN']
# Exclude files. A list of regular expressions to match. Filebeat drops the files that
# are matching any regular expression from the list. By default, no files are dropped.
#prospector.scanner.exclude_files: ['.gz$']
# Optional additional fields. These fields can be freely picked
# to add additional information to the crawled log files for filtering
#fields:
# level: debug
# review: 1
# ============================== Filebeat modules ==============================
filebeat.config.modules:
# Glob pattern for configuration loading
path: ${path.config}/modules.d/*.yml
# Set to true to enable config reloading
reload.enabled: false
# Period on which files under path should be checked for changes
#reload.period: 10s
# ======================= Elasticsearch template setting =======================
setup.template.settings:
index.number_of_shards: 1
#index.codec: best_compression
#_source.enabled: false
# ================================== General ===================================
# The name of the shipper that publishes the network data. It can be used to group
# all the transactions sent by a single shipper in the web interface.
#name:
# The tags of the shipper are included in their own field with each
# transaction published.
#tags: ["service-X", "web-tier"]
# Optional fields that you can specify to add additional information to the
# output.
#fields:
# env: staging
# ================================= Dashboards =================================
# These settings control loading the sample dashboards to the Kibana index. Loading
# the dashboards is disabled by default and can be enabled either by setting the
# options here or by using the `setup` command.
#setup.dashboards.enabled: false
# The URL from where to download the dashboards archive. By default this URL
# has a value which is computed based on the Beat name and version. For released
# versions, this URL points to the dashboard archive on the artifacts.elastic.co
# website.
#setup.dashboards.url:
# =================================== Kibana ===================================
# Starting with Beats version 6.0.0, the dashboards are loaded via the Kibana API.
# This requires a Kibana endpoint configuration.
setup.kibana:
# Kibana Host
# Scheme and port can be left out and will be set to the default (http and 5601)
# In case you specify and additional path, the scheme is required: http://localhost:5601/path
# IPv6 addresses should always be defined as: https://[2001:db8::1]:5601
host: "http://133.186.214.37:5601"
# Kibana Space ID
# ID of the Kibana Space into which the dashboards should be loaded. By default,
# the Default Space will be used.
#space.id:
# =============================== Elastic Cloud ================================
# These settings simplify using Filebeat with the Elastic Cloud (https://cloud.elastic.co/).
# The cloud.id setting overwrites the `output.elasticsearch.hosts` and
# `setup.kibana.host` options.
# You can find the `cloud.id` in the Elastic Cloud web UI.
#cloud.id:
# The cloud.auth setting overwrites the `output.elasticsearch.username` and
# `output.elasticsearch.password` settings. The format is `<user>:<pass>`.
#cloud.auth:
# ================================== Outputs ===================================
# Configure what output to use when sending the data collected by the beat.
# ---------------------------- Elasticsearch Output ----------------------------
#output.elasticsearch:
# Array of hosts to connect to.
#hosts: ["http://133.186.214.37:9200"]
# Protocol - either `http` (default) or `https`.
#protocol: "https"
# Authentication credentials - either API key or username/password.
#api_key: "id:api_key"
#username: "elastic"
#password: "changeme"
# ------------------------------ Logstash Output -------------------------------
# The Logstash hosts
output:
logstash:
hosts: ["133.186.214.37:5000"]
timeout: 10
bulk_max_size: 1024
# Optional SSL. By default is off.
# List of root certificates for HTTPS server verifications
#ssl.certificate_authorities: ["/etc/pki/root/ca.pem"]
# Certificate for SSL client authentication
#ssl.certificate: "/etc/pki/client/cert.pem"
# Client Certificate Key
#ssl.key: "/etc/pki/client/cert.key"
# ================================= Processors =================================
processors:
- add_host_metadata:
when.not.contains.tags: forwarded
- add_cloud_metadata: ~
- add_docker_metadata: ~
- add_kubernetes_metadata: ~
# ================================== Logging ===================================
# Sets log level. The default log level is info.
# Available log levels are: error, warning, info, debug
#logging.level: debug
# At debug level, you can selectively enable logging only for some components.
# To enable all selectors use ["*"]. Examples of other selectors are "beat",
# "publisher", "service".
#logging.selectors: ["*"]
# ============================= X-Pack Monitoring ==============================
# Filebeat can export internal metrics to a central Elasticsearch monitoring
# cluster. This requires xpack monitoring to be enabled in Elasticsearch. The
# reporting is disabled by default.
# Set to true to enable the monitoring reporter.
#monitoring.enabled: false
# Sets the UUID of the Elasticsearch cluster under which monitoring data for this
# Filebeat instance will appear in the Stack Monitoring UI. If output.elasticsearch
# is enabled, the UUID is derived from the Elasticsearch cluster referenced by output.elasticsearch.
#monitoring.cluster_uuid:
# Uncomment to send the metrics to Elasticsearch. Most settings from the
# Elasticsearch output are accepted here as well.
# Note that the settings should point to your Elasticsearch *monitoring* cluster.
# Any setting that is not set is automatically inherited from the Elasticsearch
# output configuration, so if you have the Elasticsearch output configured such
# that it is pointing to your Elasticsearch monitoring cluster, you can simply
# uncomment the following line.
#monitoring.elasticsearch:
# ============================== Instrumentation ===============================
# Instrumentation support for the filebeat.
#instrumentation:
# Set to true to enable instrumentation of filebeat.
#enabled: false
# Environment in which filebeat is running on (eg: staging, production, etc.)
#environment: ""
# APM Server hosts to report instrumentation results to.
#hosts:
# - http://localhost:8200
# API Key for the APM Server(s).
# If api_key is set then secret_token will be ignored.
#api_key:
# Secret token for the APM Server(s).
#secret_token:
# ================================= Migration ==================================
# This allows to enable 6.7 migration aliases
#migration.6_to_7.enabled: true이 방식으로 키바나에서 직접 로깅을 확인할 수 있습니다.
Reference
Reading HttpServletRequest Multiple Times in Spring
The input stream of HttpServletRequest can only be read once
우분투 18.04 Docker & Docker-Compose 설치
docker-compose 이용해 ELK Stack 구축하기

ContentCachingRequestWrapper를 사용해도 Filter에서 Request 정보를 알 수 있는데 ContentCachingRequestWrapper를 사용하지 않은 이유를 조금더 디테일하게 설명해주실 수 있나요?