Overview
C10K 문제는 1만개의 클라이언트 문제라고 하여 1999년 단 케겔(Dan Kegel)이 제시한 이야기입니다. ‘1만 개의 클라이언트를 동시에 처리할 수 있는 네트워크 I/O 모델 설계 방법’을 묻는 말이며 여기에서 ‘동시에’라는 단어의 의미는 통상 1초를 뜻한다고 합니다.
하지만 1999년은 꽤나 오래전입니다. 컴퓨터 성능은 비용대비 10배이상 좋아졌습니다. 그렇다면 1만개 클라이언트 정도는 예전에나 유효했던 이야기일까요?
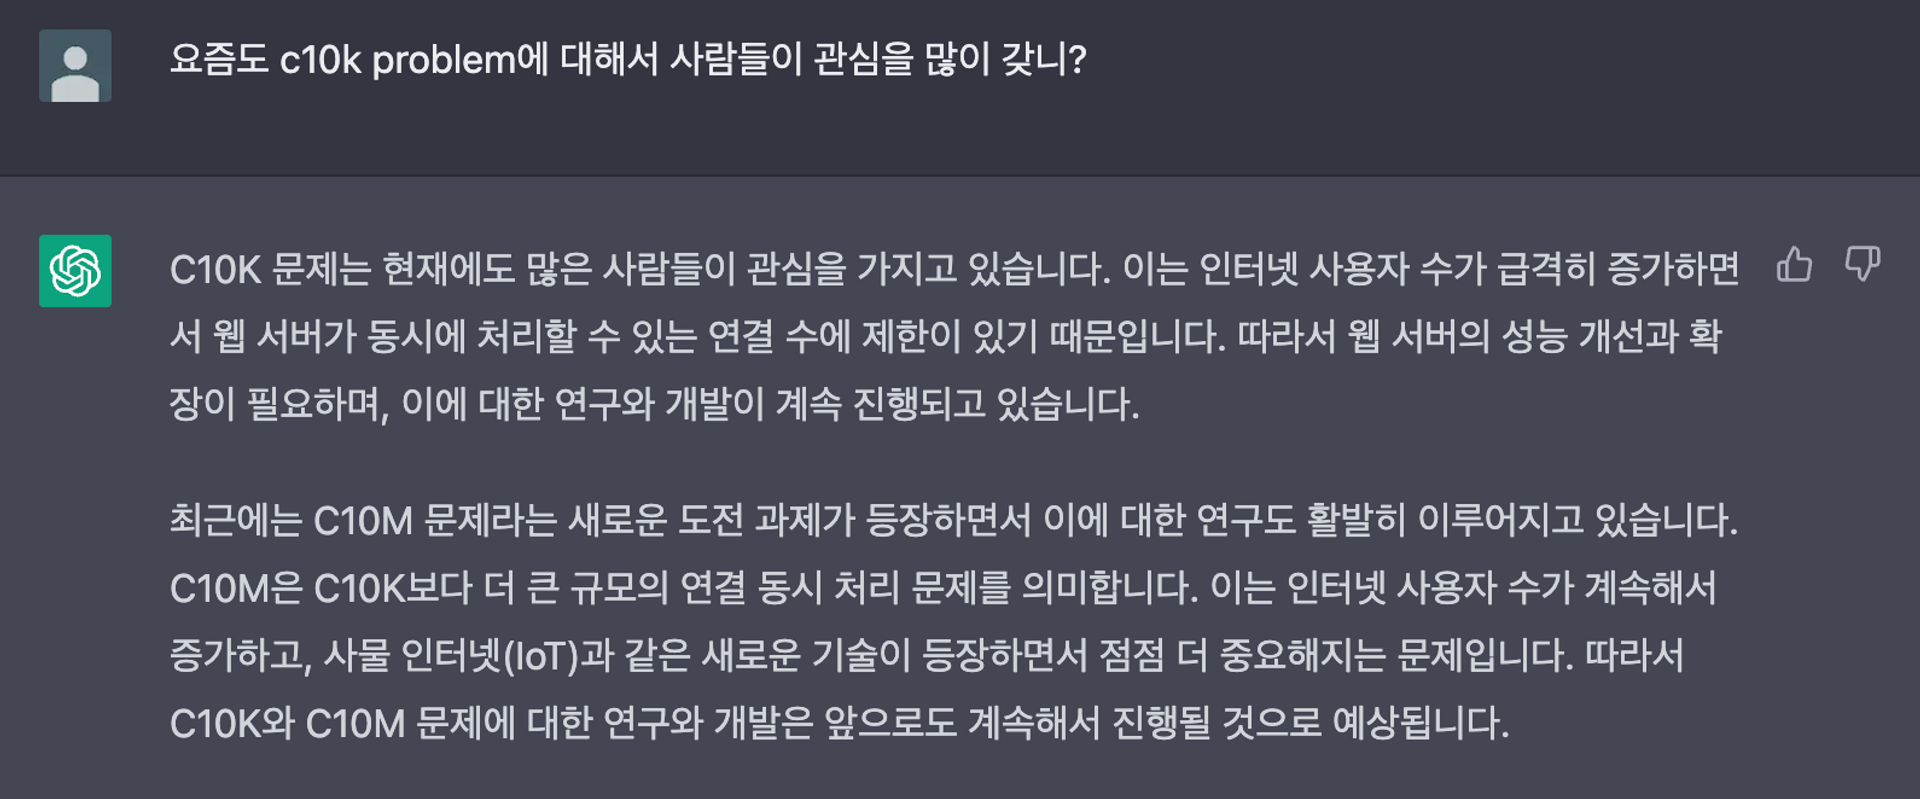
놀랍게도 ChatGPT 선생님은 현재에도 많은 사람들이 관심을 가지고 있다고 합니다. 인터넷 서비스의 사용량과 규모가 계속해서 증가하고 있고 IoT 및 대규모 실시간 웹 요청을 처리하는 애플리케이션이 늘어났습니다. 이에 따라 동시에 많은 연결과 데이터를 처리해야하고 이를 처리하지 못하면 서비스의 성능 저하, 장애, 불안정성 등 다양한 문제가 발생할 수 있습니다. 안정적이고 높은 성능의 인터넷 서비스를 제공하기 위해서 우리는 단일 애플리케이션의 성능 최적화에 대해서 고민할 필요가 있습니다.
저는 최근 이 문제에 대해서 관심을 가지면서 실험을 할 수 있는 기본적인 환경을 구축하려고 합니다. 제가 작성한 코드가 실제로 대규모 트래픽 환경에서 어떠한 장애를 갖는지를 판단하기 위해서는 대규모 트래픽 환경을 재현하는 테스트 로직이 필요하다고 생각했습니다. 그렇게 부하테스트(load test)에 대해 관심을 가지게 되었습니다.
이번 글에서는 최근에 알게 된 부하테스트 툴인 ‘k6’에 대해서 이야기하려고 합니다. 부하테스트는 대규모의 사용자 요청에 대해서 서버의 성능을 측정하고 발생한 문제를 분석할 수 있습니다. k6는 모니터링 시각화 도구로 유명한 Grafana를 개발하고 있는 Grafana Labs에서 개발한 부하테스트 툴입니다.
k6는 테스트 케이스를 자바스크립트로 작성할 수 있으며 Grafana와 연동이 쉬워 실시간 성능 지표를 간단하게 확인할 수 있습니다. 또한 k6는 외부에서 서버에 대한 요청에 대한 정보를 수집하는 역할을 하므로 Spring Boot Actuator를 이용해서 서버 애플리케이션의 내부 상태도 같이 확인해보겠습니다.
이번 글은 chatgpt와 함께 작성해보았습니다. 핵심적인 내용은 레퍼런스를 확인했고 내용의 출처를 명시했습니다.
K6

k6는 위와 같이 동작합니다. 미리 작성된 자바스크립트 스크립트로 테스트 케이스를 작성하며 cli 명령으로 테스트를 실행시켜 결과를 확인할 수 있습니다. 가볍게 설치하고 별다른 client 프로그램 없이 사용할 수 있어서 많은 개발자들에게 인기를 끌고 있습니다.

k6는 go 언어로 구현된 부하테스트 툴입니다. HTTP, WebSockets, gRPC 등 다양한 프로토콜을 지원하며 필요에 따라 확장을 하기에 유용합니다. 또한 k6 클라우드 등 다양한 시각화 도구를 지원하고 있고 Azure, Github, Jenkins 등의 CI 파이프라인에 통합할 수 있습니다. 다만, 아직 0.x.x의 버전까지 출시되었으니 실무에서 사용은 신중하게 선택하시길 바랍니다.
MacOS 기준으로 작성되었으며 다른 환경에서 개발하시는 분들은 참조한 문서를 확인해주시면 감사하겠습니다 🙇
k6 Quick Start
brew install k6hombrew로 이용해서 k6를 먼저 설치해줍니다. 자세한 내용은 참조한 문서에 있습니다. 우선 저처럼 성격이 급하신분들은 빠르게 실행을 확인해보겠습니다.
http-request-sample-get.js
import { check } from "k6";
import http from "k6/http";

export default function () {
  let res = http.get("https://test.loadimpact.com/");
  check(res, {
    "is status 200": (r) => r.status === 200,
  });
}
cli command
k6 run http-request-sample-get.js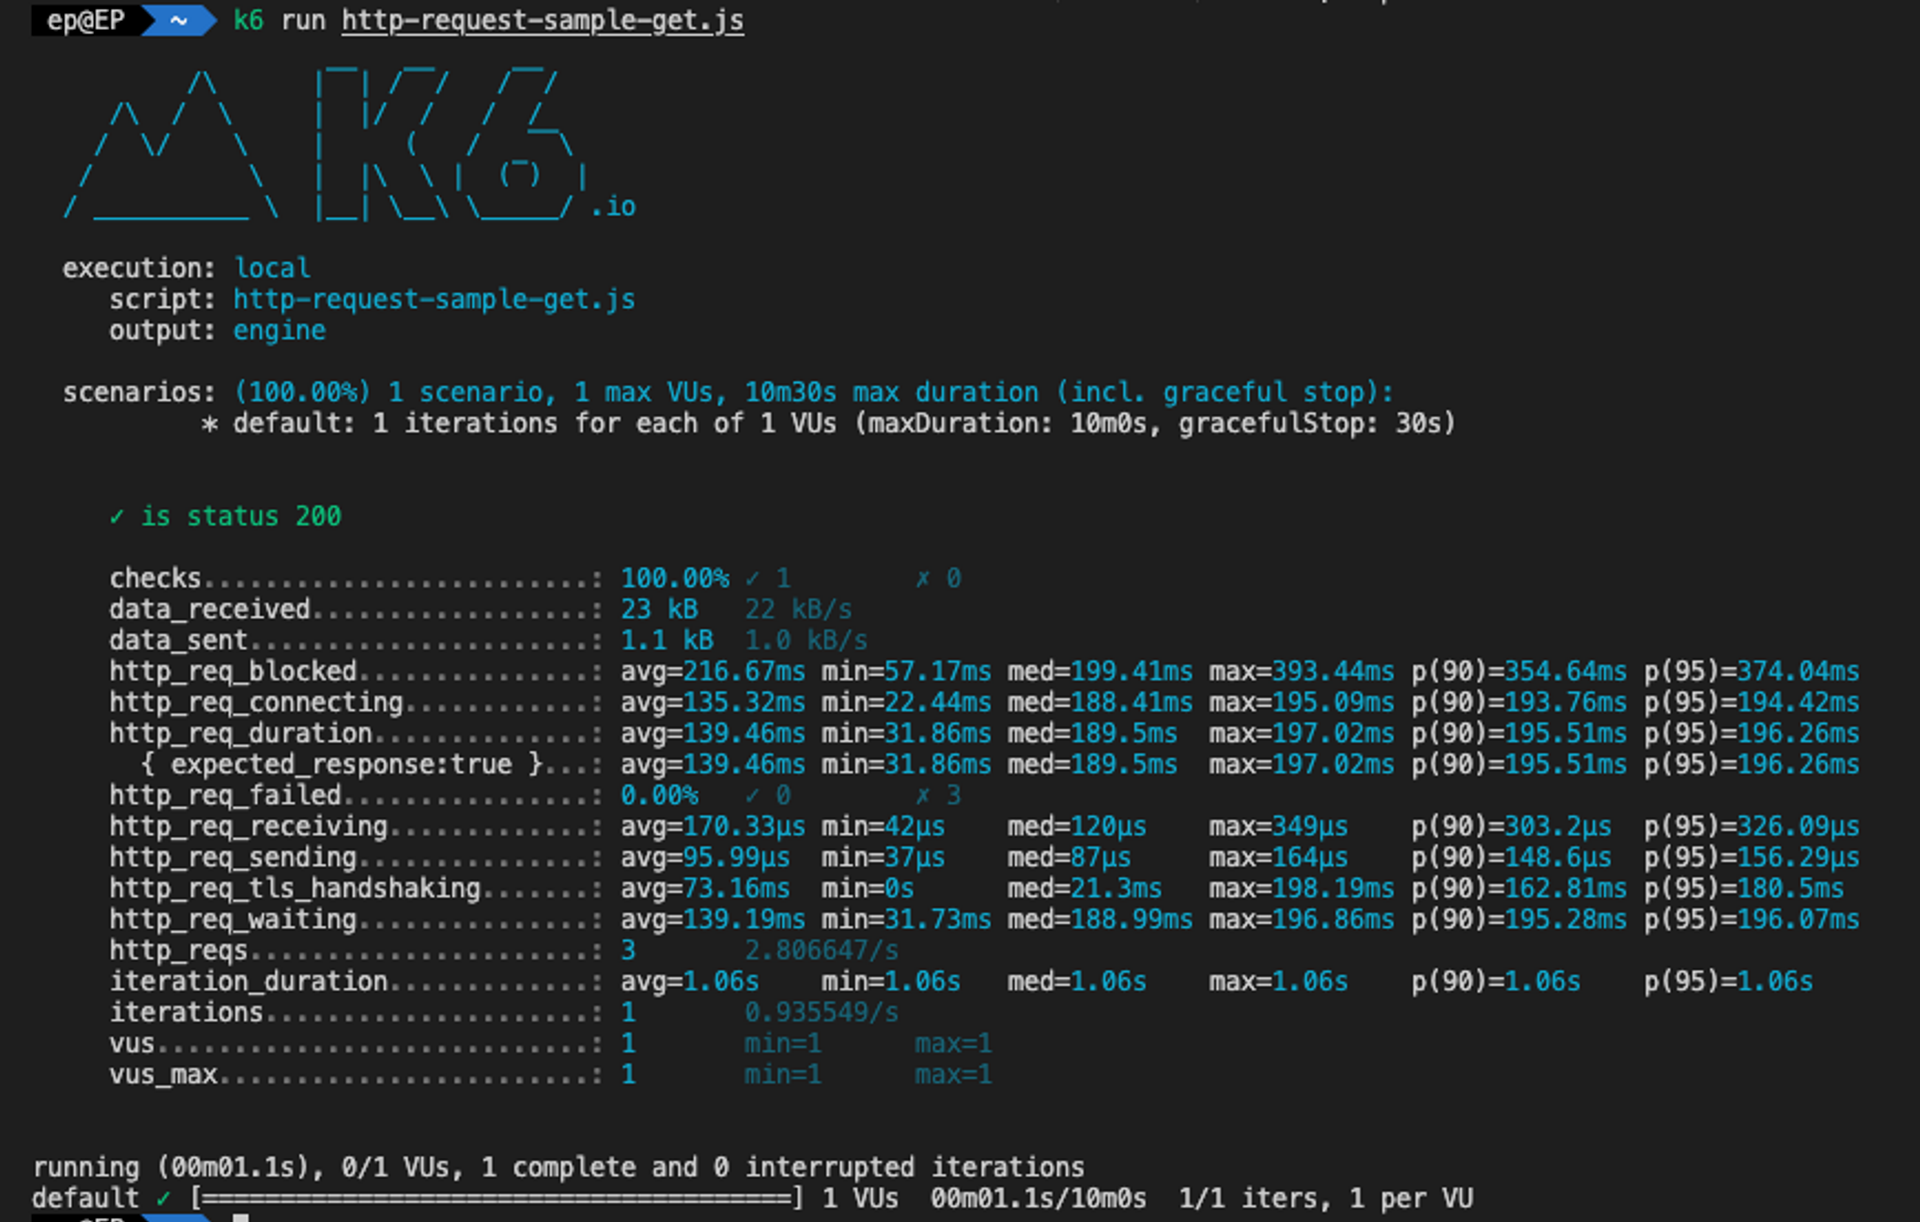
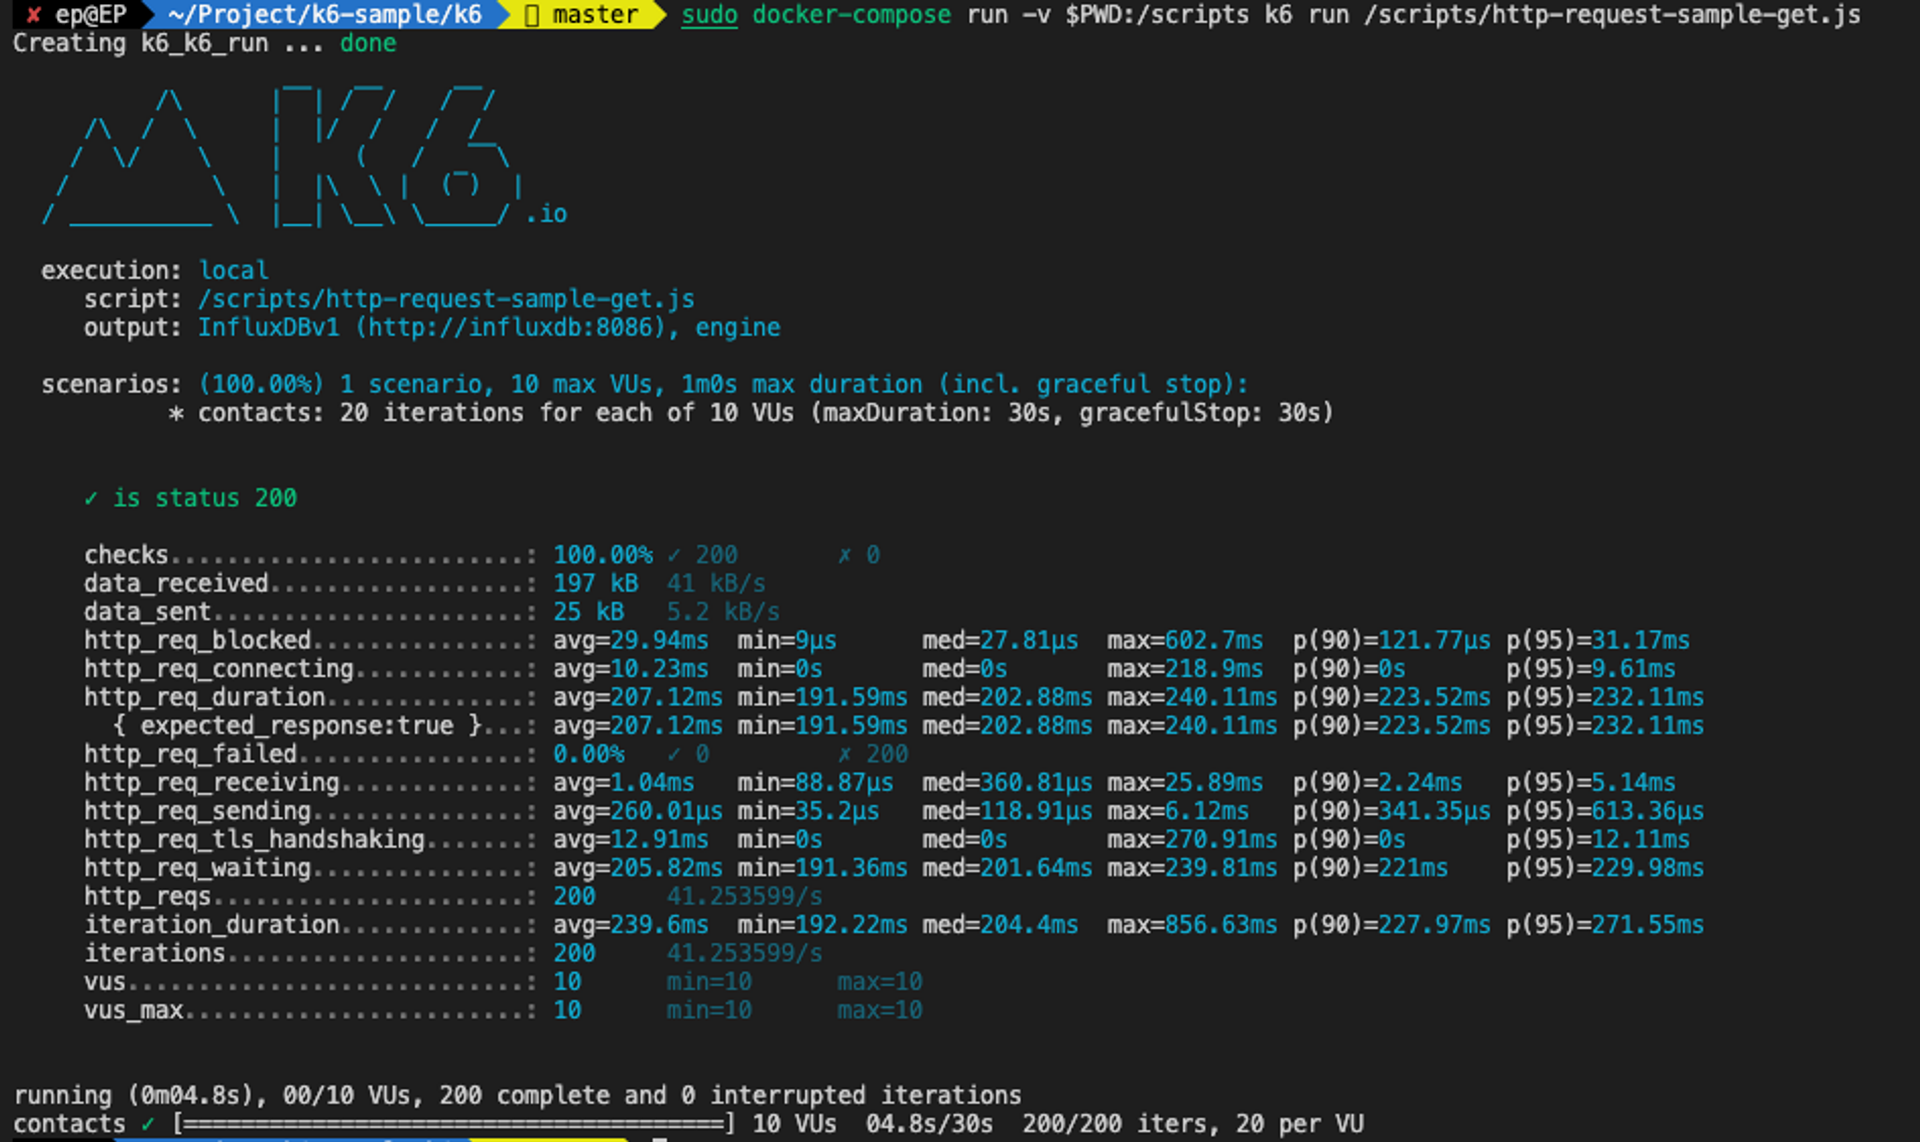
위와 같은 화면이 나오면 정상적으로 동작을 한 것입니다. 콘솔에 프린팅된 내용에서 서버에 상태를 파악할 수 있는 다양한 메트릭을 확인할 수 있습니다. 이후에서는 위에서 작성한 cli command 옵션, 스크립트에서 활용하는 메서드, k6가 제공하는 메트릭에 대해서 알아보겠습니다.
k6 테스트 실행하기
위의 테스트 케이스에서 30초 동안 10명의 가상 유저가 url 호출을 하고 모든 테스트에서 정상(200 ok)를 반환하는지 확인해보겠습니다.
k6 run -u 10 -d 30s http-request-sample-get.js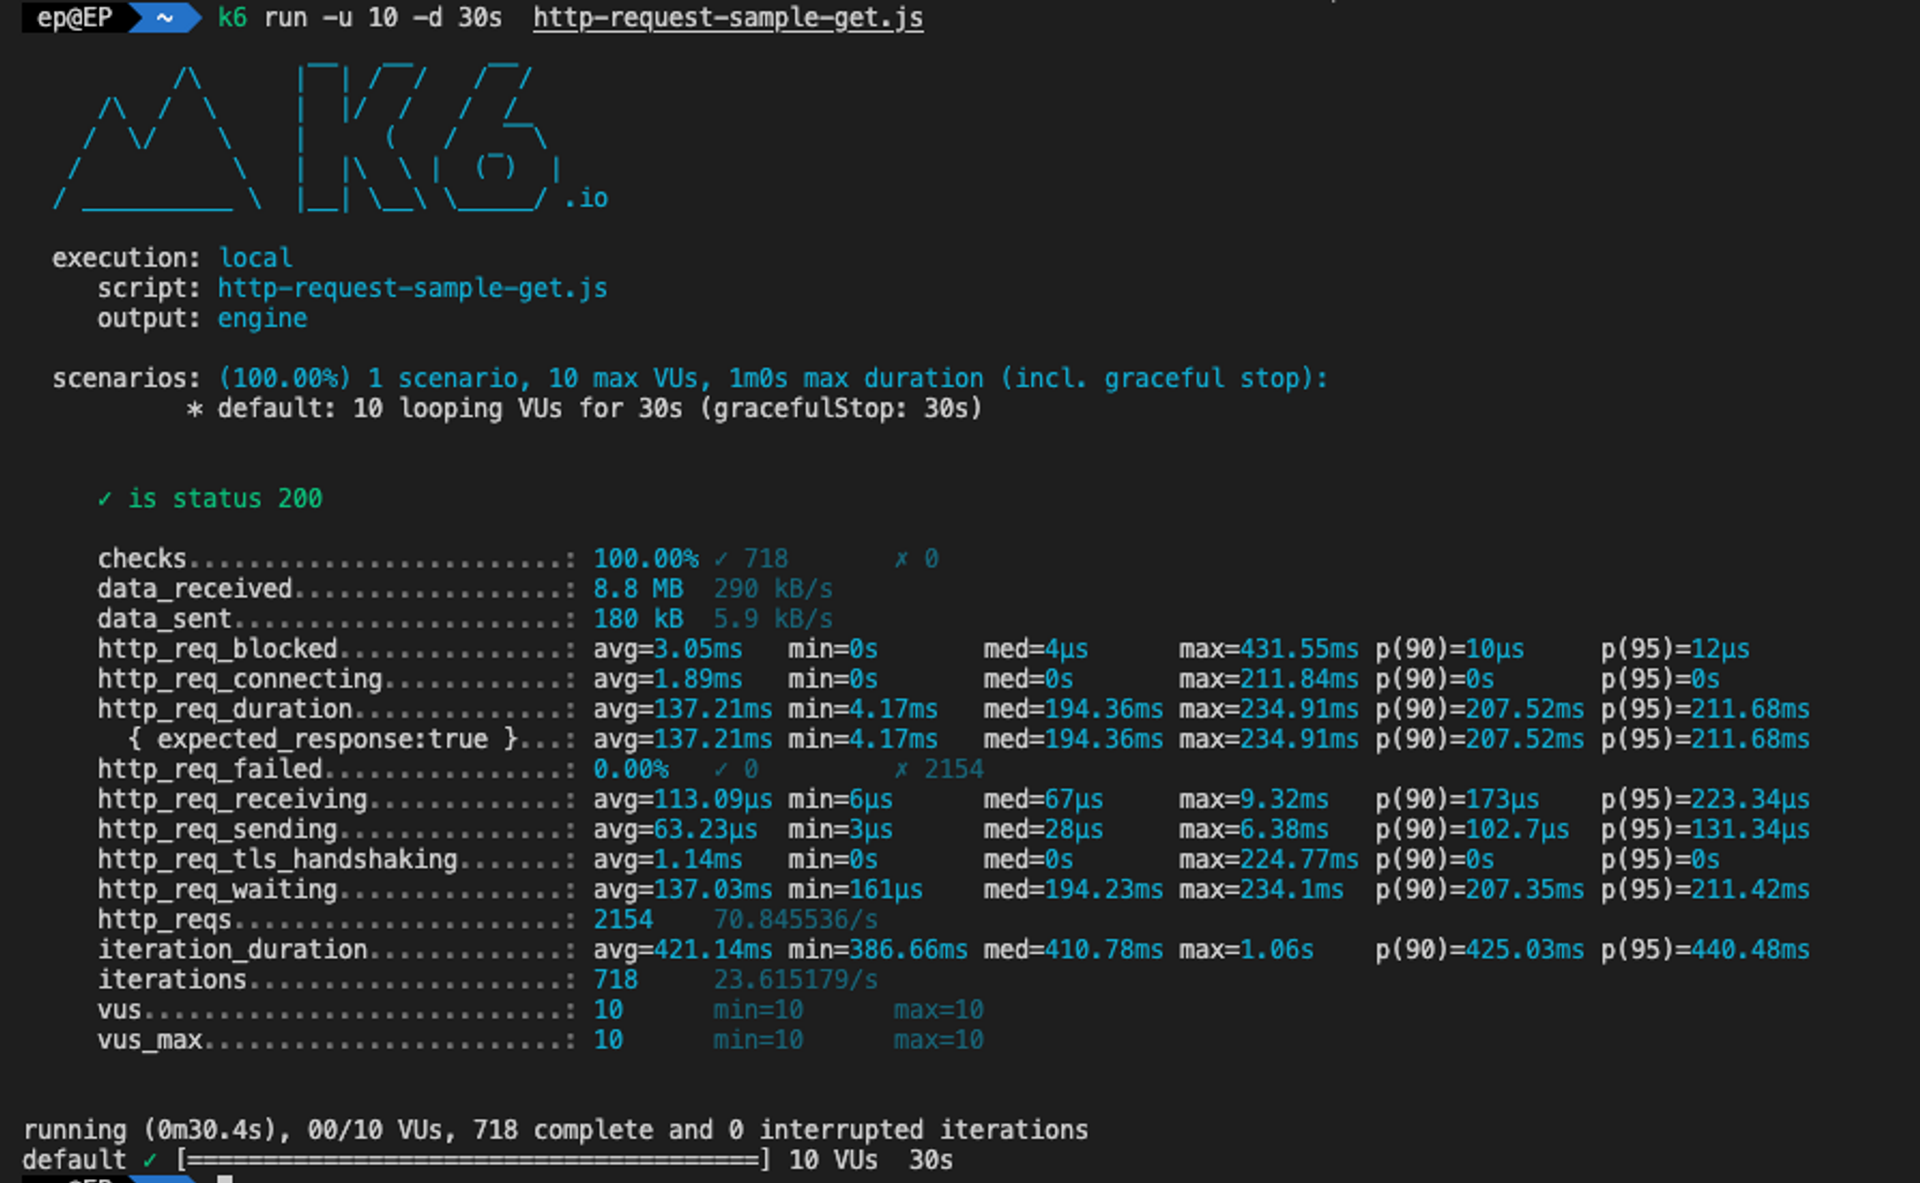
프린팅된 내용을 읽어보면 10명의 가상 유저가 30초동안 반복적으로 요청을 보냈다(10 looping VUs 30s)는 내용를 확인할 수 있습니다. 이와같은 내용을 총 718번 반복(iterations)했고 총 2154의 요청(http_reqs)이 있었다는 것을 알 수 있습니다. 모든 요청은 정상이 되었음을 확인(checks)할 수 있습니다.
cli에 입력했던 옵션을 script에 넣어서 실행할 수 있습니다. 가상 유저(vus)와 iterations, max duration을 설정해서 스크립트를 실행시킬 수 있습니다.
http-request-sample-get.js
import http from "k6/http";
import { check } from "k6";

export const options = {
  discardResponseBodies: true,
  scenarios: {
    contacts: {
      executor: "per-vu-iterations",
      vus: 10,
      iterations: 20,
      maxDuration: "30s",
    },
  },
};

export default function () {
  let res = http.get("https://test.k6.io/contacts.php");
  check(res, {
    "is status 200": (r) => r.status === 200,
  });
}
k6 run http-request-sample-get.js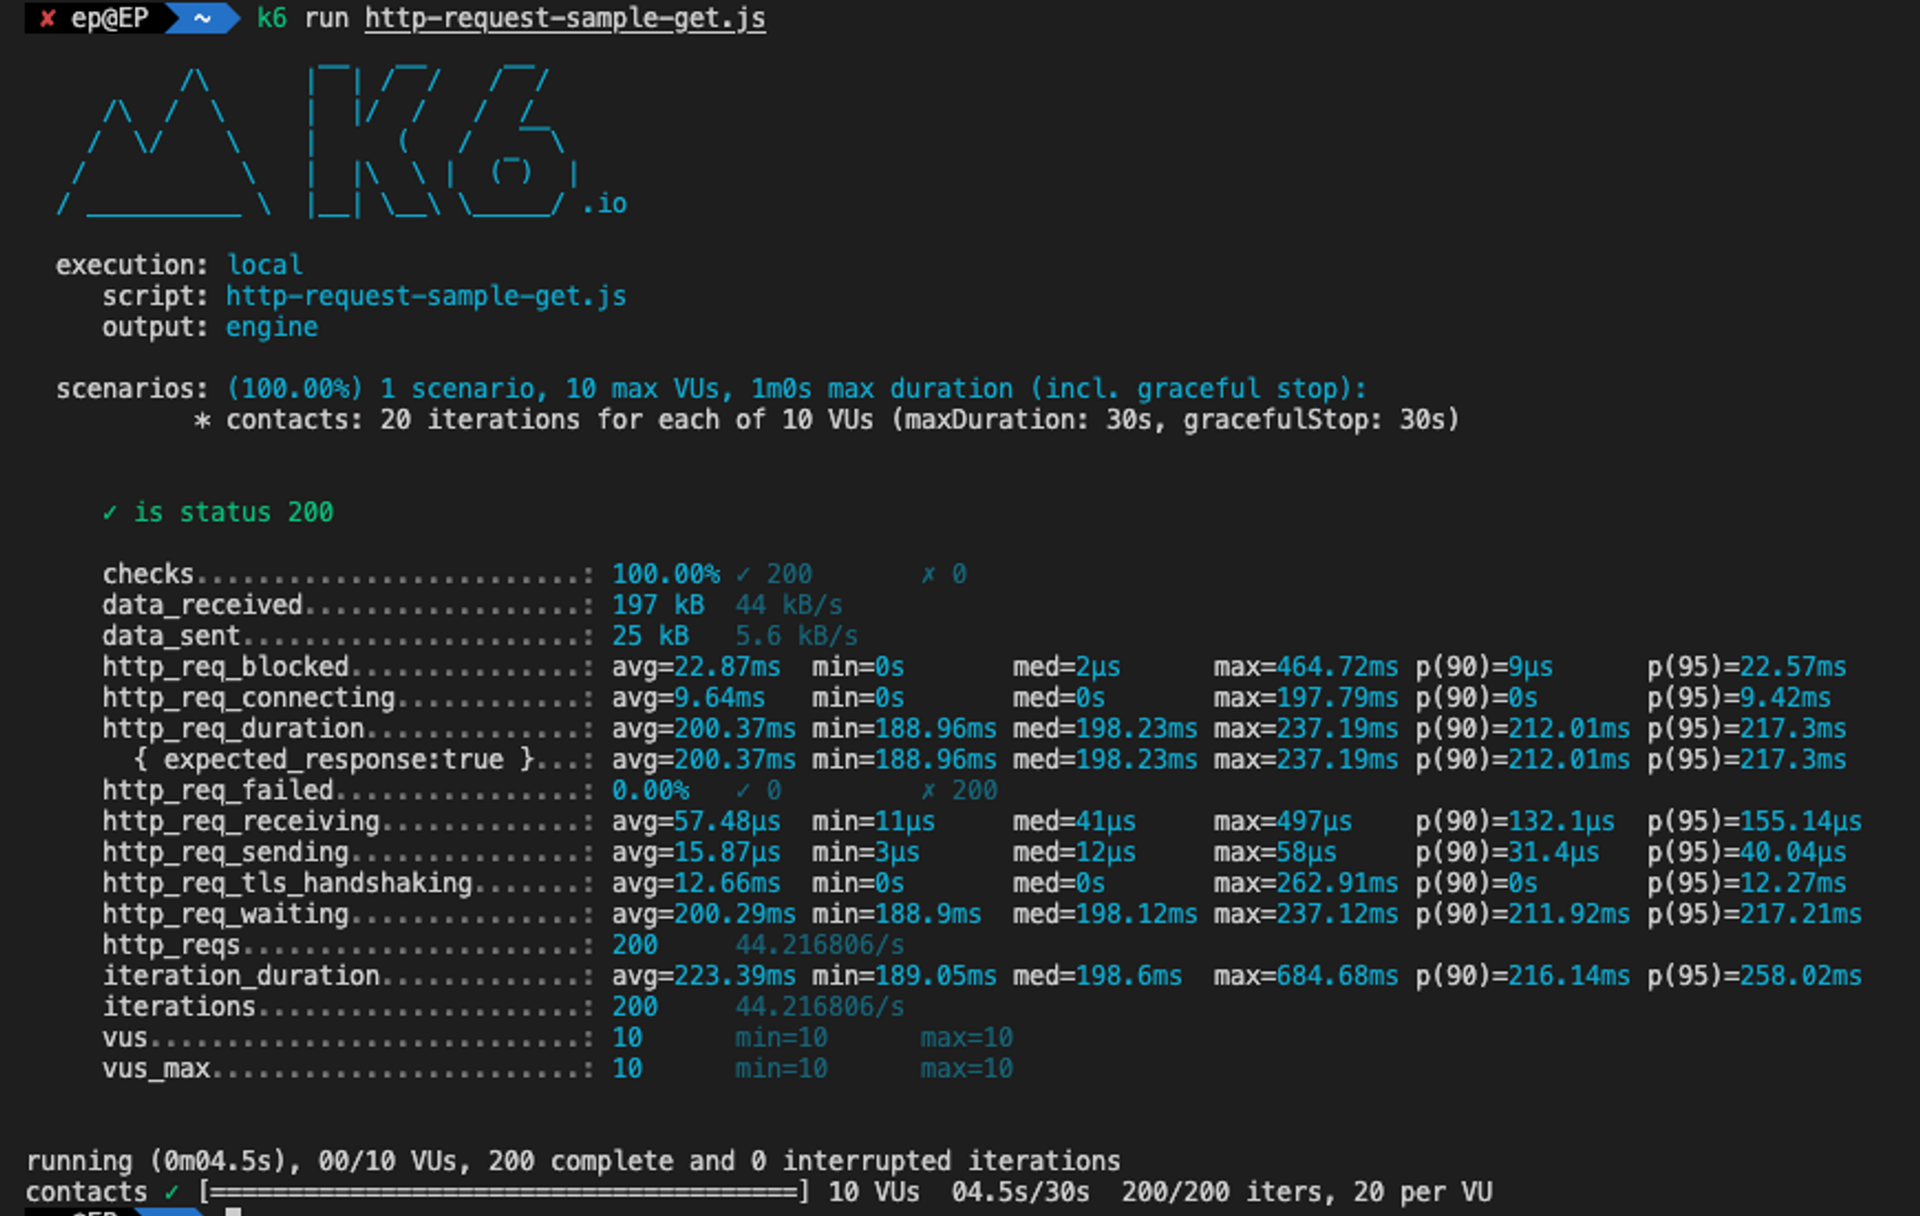
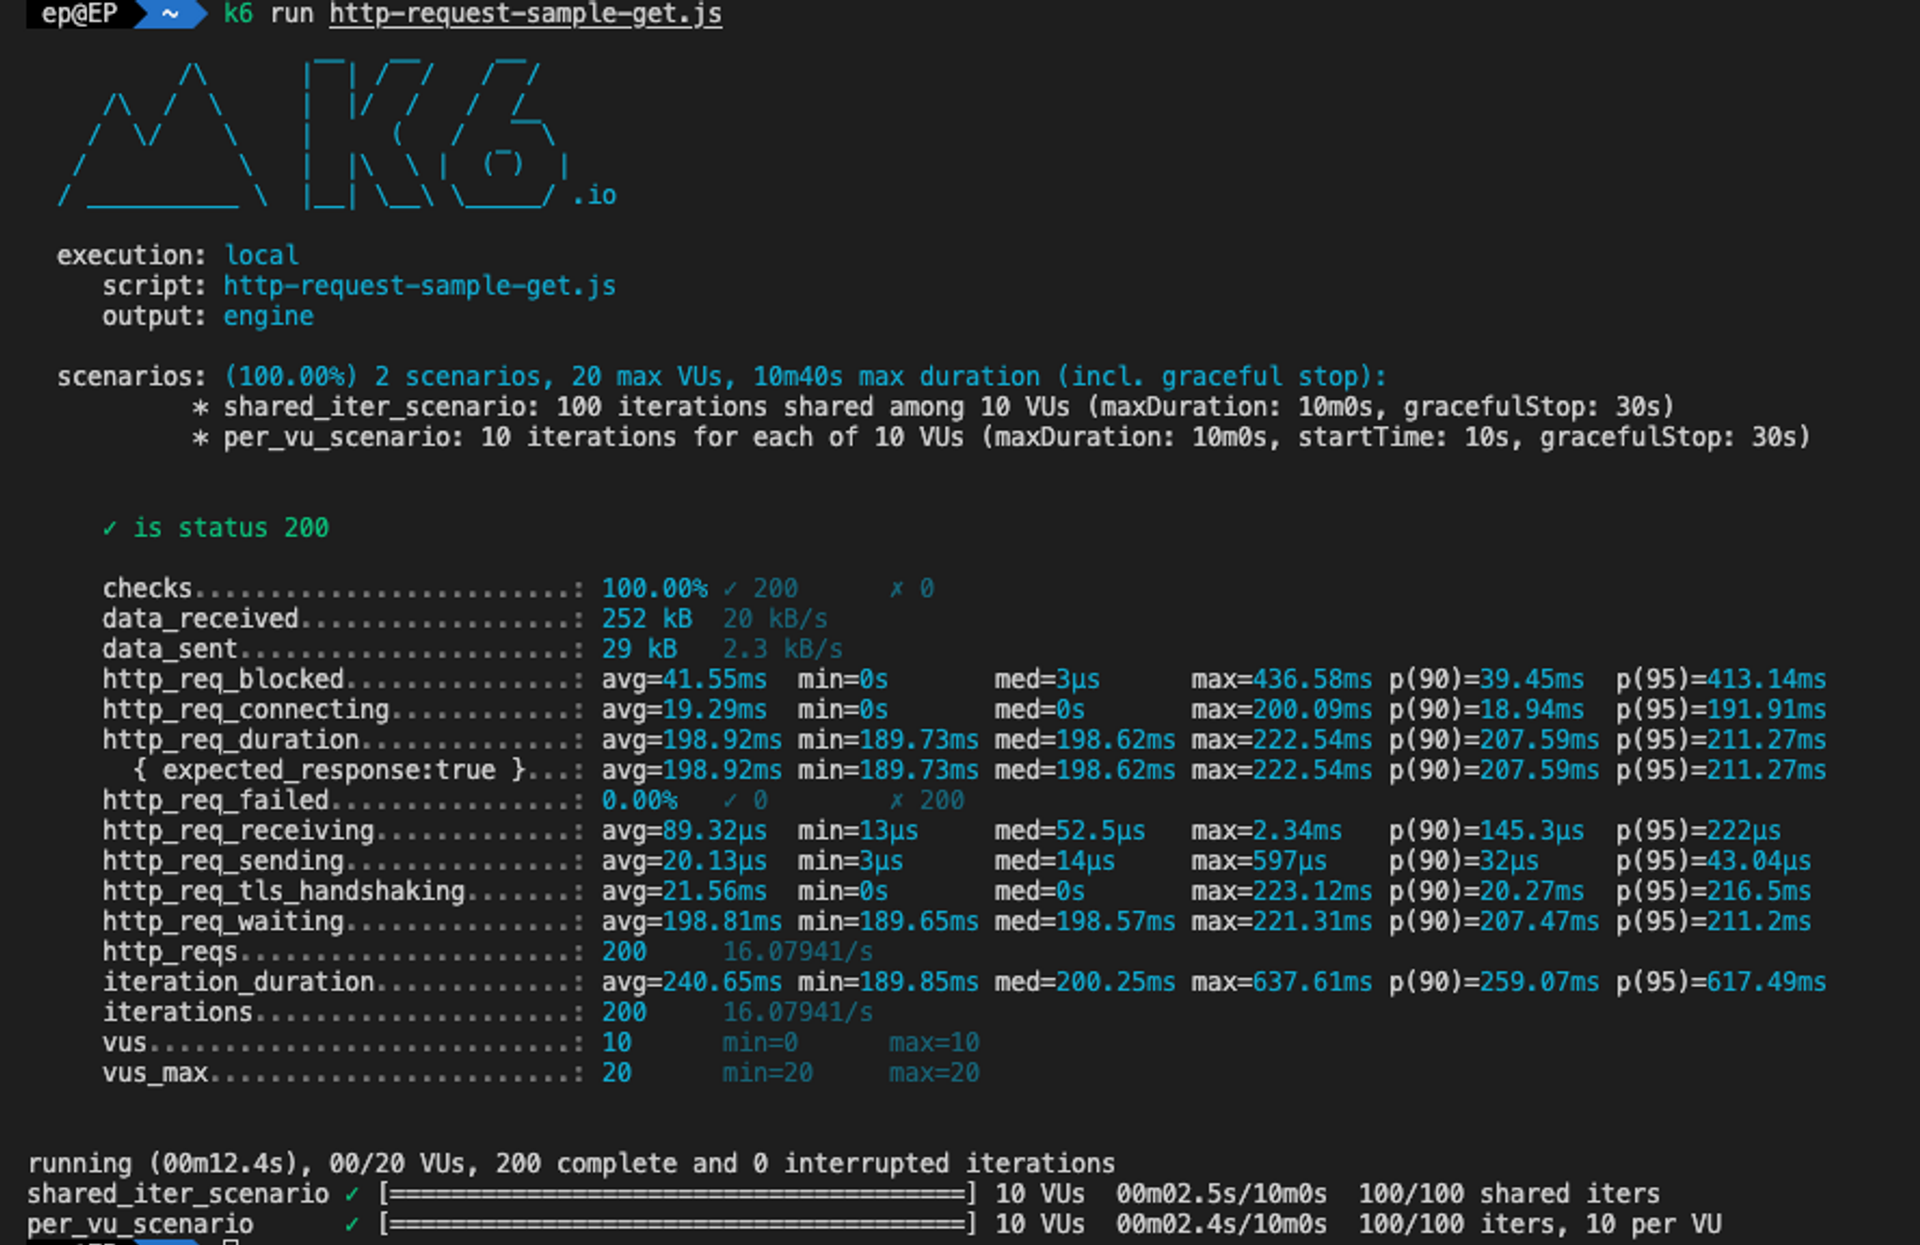
executors 설정으로 shared_iter_scenario와 per_vu_scenario를 순서대로 실행시킬 수 있습니다. 시나리오별 퍼포먼스를 확인할 수 있습니다. shared_iter_scenario는 전체의 interation을 설정할 수 있고 per_vu_scenario는 유저당 iteration을 설정할 수 있습니다. 다른 시나리오의 종류는 이 문서에서 확인할 수 있습니다.
import http from "k6/http";
import { check } from "k6";

export const options = {
  scenarios: {
    shared_iter_scenario: {
      executor: "shared-iterations",
      vus: 10,
      iterations: 100,
      startTime: "0s",
    },
    per_vu_scenario: {
      executor: "per-vu-iterations",
      vus: 10,
      iterations: 10,
      startTime: "10s",
    },
  },
};

export default function () {
  let res = http.get("https://test.k6.io/contacts.php");
  check(res, {
    "is status 200": (r) => r.status === 200,
  });
}
Beginner’s Guide to Load Testing with k6
k6 지표(metric) 확인하기
테스트 스크립트를 제대로 만들기 전에 k6가 제공하는 메트릭에 대한 이해가 있어야 합니다. 제공하는 메트릭은 다양하지만 우리는 먼저 테스트의 목적이 필요합니다. 테스트의 목적으로는 동시성, 처리량, 요청시 응답 시간, 회귀 테스트 등이 있습니다. 분산 환경에서는 애플리케이션의 속도, 확장성, 안정성, 탄력성 측면에서 시스템을 평가합니다. 우리는 정해진 목적에 맞게 매트릭을 설정하고 이를 시각화 및 트래킹하여 문제를 진단해야 합니다.
k6는 기본적으로 제공하는 빌트인(built-in) 메트릭과 사용자가 직접 설정하는 커스텀(custom) 메트릭을 제공합니다. k6가 제공하는 빌트인 메트릭은 다음과 같습니다.
| METRIC NAME | TYPE | DESCRIPTION |
|---|---|---|
| vus | Gauge | Current number of active virtual users |
| vus_max | Gauge | Max possible number of virtual users (VU resources are pre-allocated, ensuring performance will not be affected when scaling up the load level) |
| iterations | Counter | The aggregate number of times the VUs executed the JS script (the default function). |
| iteration_duration | Trend | The time it took to complete one full iteration, including time spent in setup and teardown. To calculate the duration of the iteration's function for the specific scenario, https://k6.io/docs/using-k6/workaround-to-calculate-iteration_duration |
| dropped_iterations | Counter | The number of iterations that weren't started due to lack of VUs (for the arrival-rate executors) or lack of time (expired maxDuration in the iteration-based executors). https://k6.io/docs/using-k6/scenarios/concepts/dropped-iterations/ |
| data_received | Counter | The amount of received data. https://k6.io/docs/examples/track-transmitted-data-per-url. |
| data_sent | Counter | The amount of data sent. https://k6.io/docs/examples/track-transmitted-data-per-url to track data for an individual URL. |
| checks | Rate | The rate of successful checks. |
http 요청을 수행할 때 제공하는 빌트인 메트릭은 다음과 같습니다.
| METRIC NAME | TYPE | DESCRIPTION |
|---|---|---|
| http_reqs | Counter | How many total HTTP requests k6 generated. |
| http_req_blocked | Trend | Time spent blocked (waiting for a free TCP connection slot) before initiating the request. float |
| http_req_connecting | Trend | Time spent establishing TCP connection to the remote host. float |
| http_req_tls_handshaking | Trend | Time spent handshaking TLS session with remote host |
| http_req_sending | Trend | Time spent sending data to the remote host. float |
| http_req_waiting | Trend | Time spent waiting for response from remote host (a.k.a. “time to first byte”, or “TTFB”). float |
| http_req_receiving | Trend | Time spent receiving response data from the remote host. float |
| http_req_duration | Trend | Total time for the request. It's equal to http_req_sending + http_req_waiting + http_req_receiving (i.e. how long did the remote server take to process the request and respond, without the initial DNS lookup/connection times). float |
| http_req_failed | Rate | The rate of failed requests according to https://k6.io/docs/javascript-api/k6-http/setresponsecallback. |
메트릭의 타입에 대한 설명은 다음과 같습니다.
| METRIC TYPE | DESCRIPTION |
|---|---|
| https://k6.io/docs/javascript-api/k6-metrics/counter | A metric that cumulatively sums added values. |
| https://k6.io/docs/javascript-api/k6-metrics/gauge | A metric that stores the min, max and last values added to it. |
| https://k6.io/docs/javascript-api/k6-metrics/rate | A metric that tracks the percentage of added values that are non-zero. |
| https://k6.io/docs/javascript-api/k6-metrics/trend | A metric that allows for calculating statistics on the added values (min, max, average and percentiles). |
커스텀 메트릭은 아래와 같이 라이브러리에서 제공하는 객체를 사용하여 테스트할 수 있습니다.
import { Counter, Gauge, Trend, Rate } from "k6/metrics";

export const options = {
  discardResponseBodies: true,
  scenarios: {
    contacts: {
      executor: "per-vu-iterations",
      vus: 10,
      iterations: 20,
      maxDuration: "30s",
    },
  },
};

const myCounter = new Counter("my_counter");
const myGauge = new Gauge("my_gauge");
const myTrend = new Trend("my_trend");
const myRate = new Rate("my_rate");

export default function () {
  myCounter.add(1);
  myCounter.add(2);

  myGauge.add(3);
  myGauge.add(1);
  myGauge.add(2);

  myTrend.add(1);
  myTrend.add(2);

  myRate.add(true);
  myRate.add(false);
  myRate.add(1);
  myRate.add(0);
}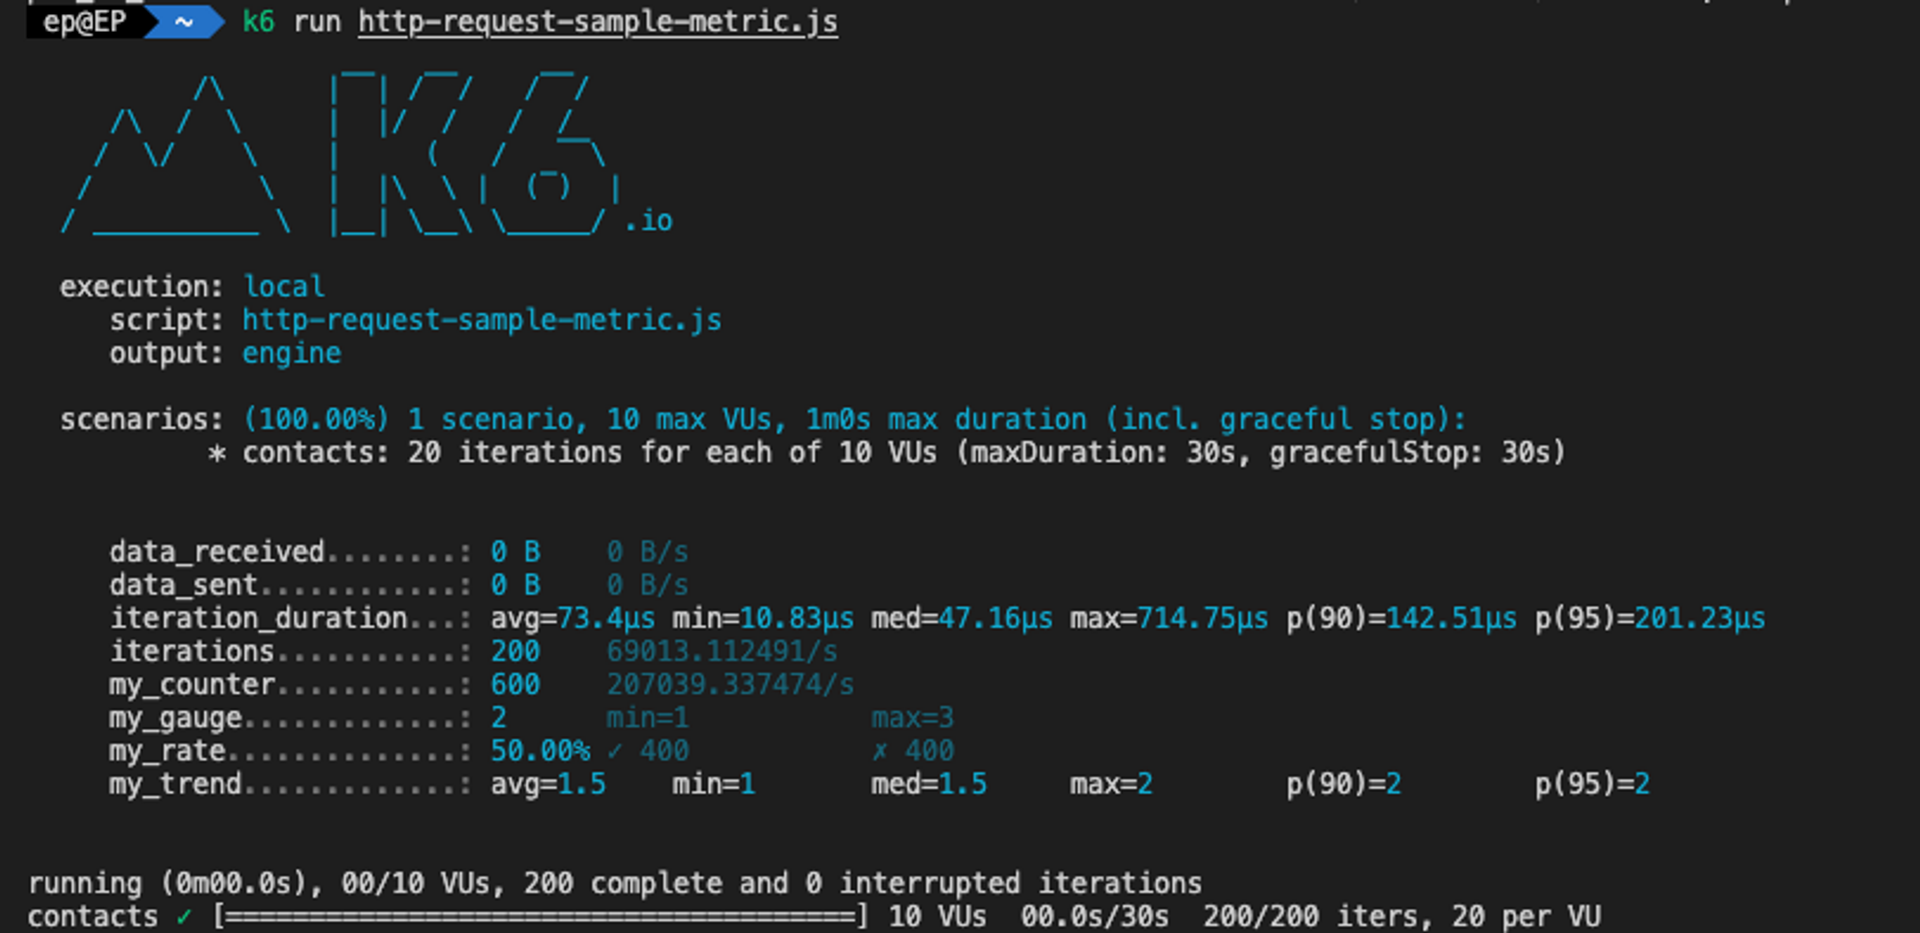
각 커스텀 메트릭에 대한 결과를 프린팅된 내용에서 확인할 수 있습니다. 평균, 최대갓/최소값, 비율, 트렌드 등의 형태로 메트릭을 보여줍니. 자세한 내용을 확인하려면 이 문서를 참고해주세요.
Beginner’s Guide to Load Testing with k6
k6 테스트 케이스 작성하기
k6는 테스트 생명주기를 4단계로 정의 했습니다.
- Code in the init context prepares the script, loading files, importing modules, and defining the test lifecycle functions. Required.
- The setup function runs, setting up the test environment and generating data. Optional.
- VU code runs in the default or scenario function, running for as long and as many times as the options define. Required.
- The teardown function runs, postprocessing data and closing the test environment. Optional.
| TEST STAGE | PURPOSE | EXAMPLE | CALLED |
|---|---|---|---|
| 1. init | Load local files, import modules, declare lifecycle functions | Open JSON file, Import module | Once per VU* |
| 2. Setup | Set up data for processing, share data among VUs | Call API to start test environment | Once |
| 3. VU code | Run the test function, usually default | Make https requests, validate responses | Once per iteration, as many times as the test options require |
| 4. Teardown | Process result of setup code, stop test environment | Validate that setup had a certain result, send webhook notifying that test has finished |
example
// 1. init code

export function setup() {
  // 2. setup code
}

export default function (data) {
  // 3. VU code
}

export function teardown(data) {
  // 4. teardown code
}
어렵게 설명되어있지만 사실 단순히 순서정도로 이해해도 큰 문제가 없습니다. 나중에 테스트 케이스의 고도화가 들어갈 때 참조하시면서 사용하시면 좋을 것 같습니다. 다만 k6에서 제공하는 함수들 중 유용한 기능이 많으니 코드를 작성할 때 활용하면 다양한 테스트 케이스를 구현할 수 있습니다.
K6 & Grafana 연동 (Docker Compose)
일일이 테스트 내용을 캡쳐할 수 없으니 스토리지에 저장하고 시각화해보겠습니다. k6를 만든 grafana labs의 grafana와 influxdb를 사용해보겠습니다.
- influxdb 1.8
- grafana 9.3.x
- k6 0.43.x
Grafana 사용 이유
Grafana는 성능 및 가동 시간 모니터링 등에 널리 사용되는 대중적인 오픈소스 데이터 시각화 도구입니다. 기본 제공 기능과 커뮤니티에서 기여한 수많은 플러그인을 사용하여 많은 방식으로 시계열 데이터를 표시할 수 있습니다. k6는 influxdb를 통해 의미있는 데이터를 저장하고 grafna를 통해 시각화할 수 있었습니다. 이 글에서 grafana에 대한 자세한 설명은 다루지는 않으니 공식 문서를 참고해주시길 바랍니다.
InfluxDB 사용 이유
InfluxDB는 시계열 데이터에 특화된 데이터베이스로, Grafana가 주로 사용하는 데이터 스토리지입니다. Grafana와 k6 모두 InfluxDB를 기본적으로 지원하므로, 이 둘을 간편하게 연결할 수 있습니다. 이 글에서 influxdb에 대한 자세한 설명은 다루지 않으니 공식 문서를 참고해주시길 바랍니다.
InfluxDB & Grafana Docker-Compose로 실행하기
git clone https://github.com/grafana/k6 && cd k6
git submodule update --init
docker-compose up -d influxdb grafana
docker-compose를 사용하면 Grafana와 InfluxDB를 쉽게 설치할 수 있습니다. docker-compose.yml은 k6의 공식 리포지토리에서 확인할 수 있습니다. 이를 실행시키면 http://localhost:3000/ 에서 대시보드를 확인할 수 있습니다.
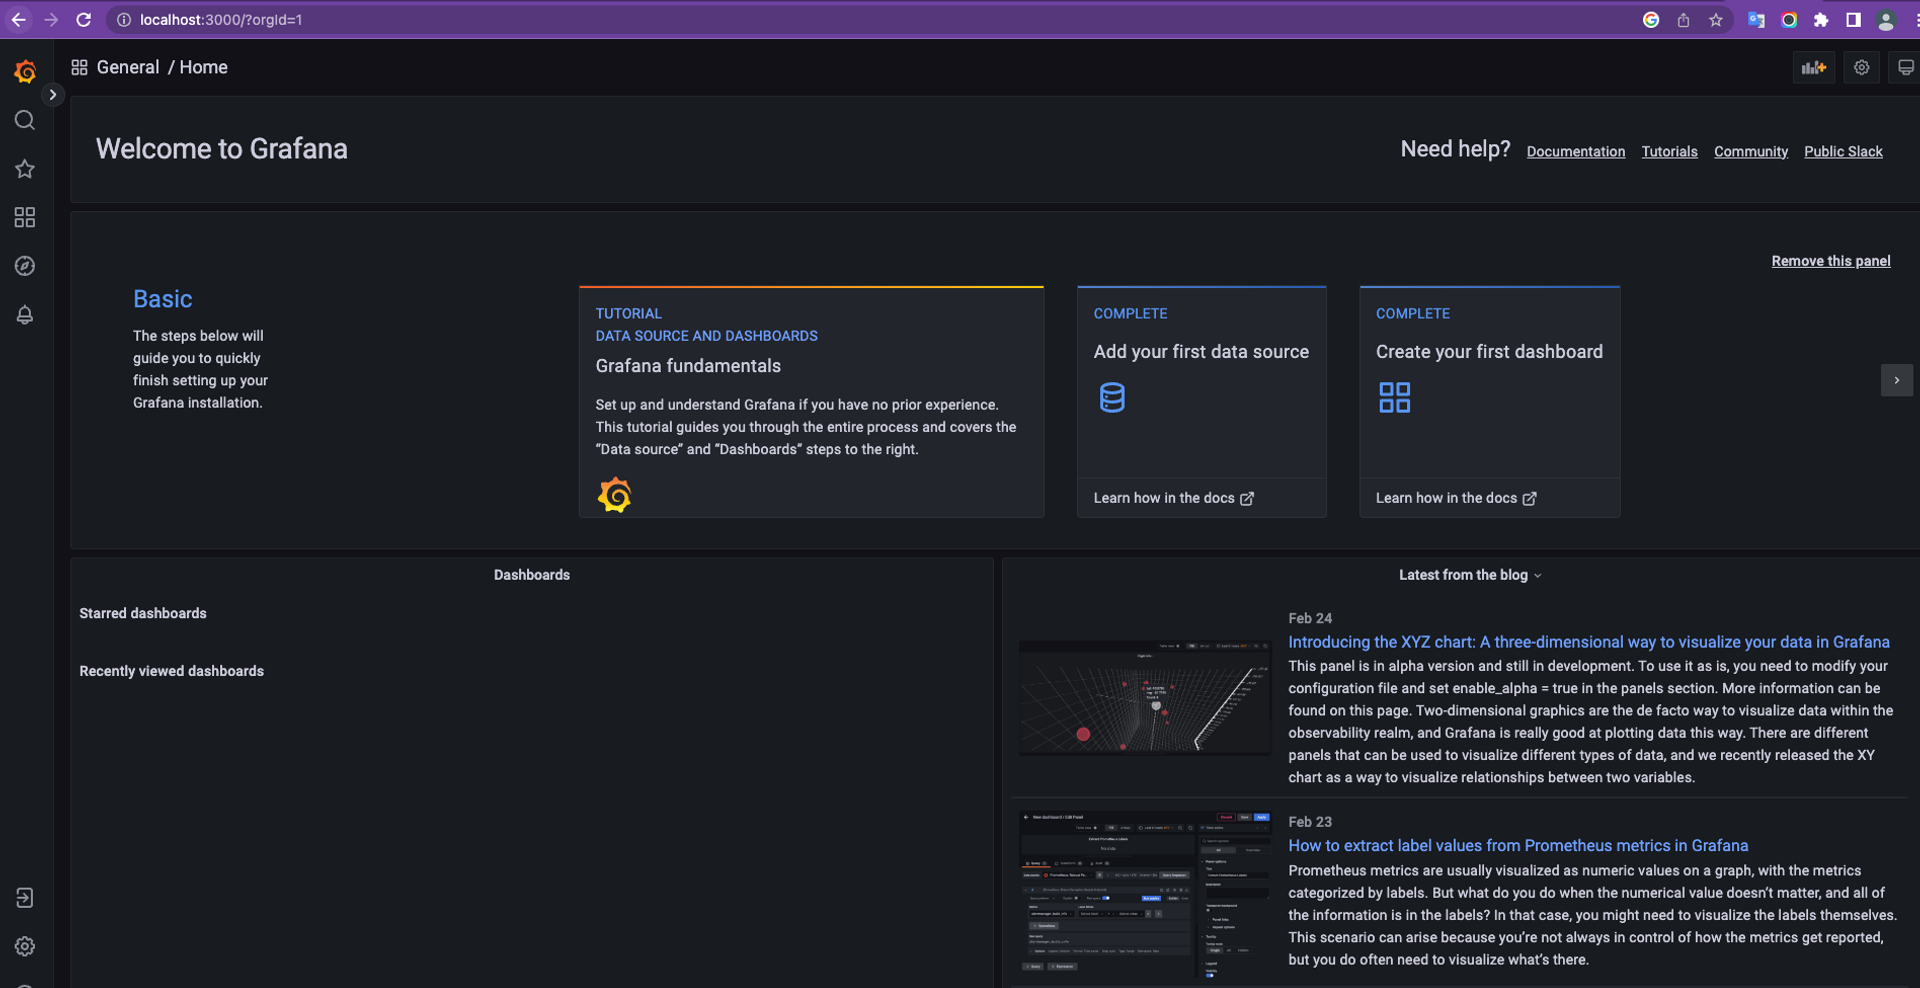
Grafana는 docker-compose에 의해 시작된 로컬 InfluxDB에서 데이터를 읽도록 구성되어 있습니다. 아직 시각화할 데이터가 없으니 k6를 실행시켜서 InfluxDB에 데이터를 저장하고 시각화해보겠습니다.
우선 아까 작성한 js파일을 git clone한 k6 디렉토리에 위치시킵니다. 그리고 다음과 같은 명령어로 실행시킵니다.
docker-compose run -v $PWD:/scripts k6 run /scripts/myscript.jsdocker-compose로 실행을 시키면 k6는 결과를 InfluxDB로 보내도록 사전 구성이 되어있어서 별다른 설정을 해줄 필요가 없습니다. -v 옵션은 Docker 컨테이너의 /scripts 아래에 현재 작업 디렉터리($PWD:/scripts)를 마운트하므로 k6은 /scripts에 엑세스하여 파일을 읽을 수 있습니다.
k6 테스트를 실행시키고 Grafana의 대시보드를 확인해보겠습니다.
http://localhost:3000/ 에 접속하여 패널을 만들고
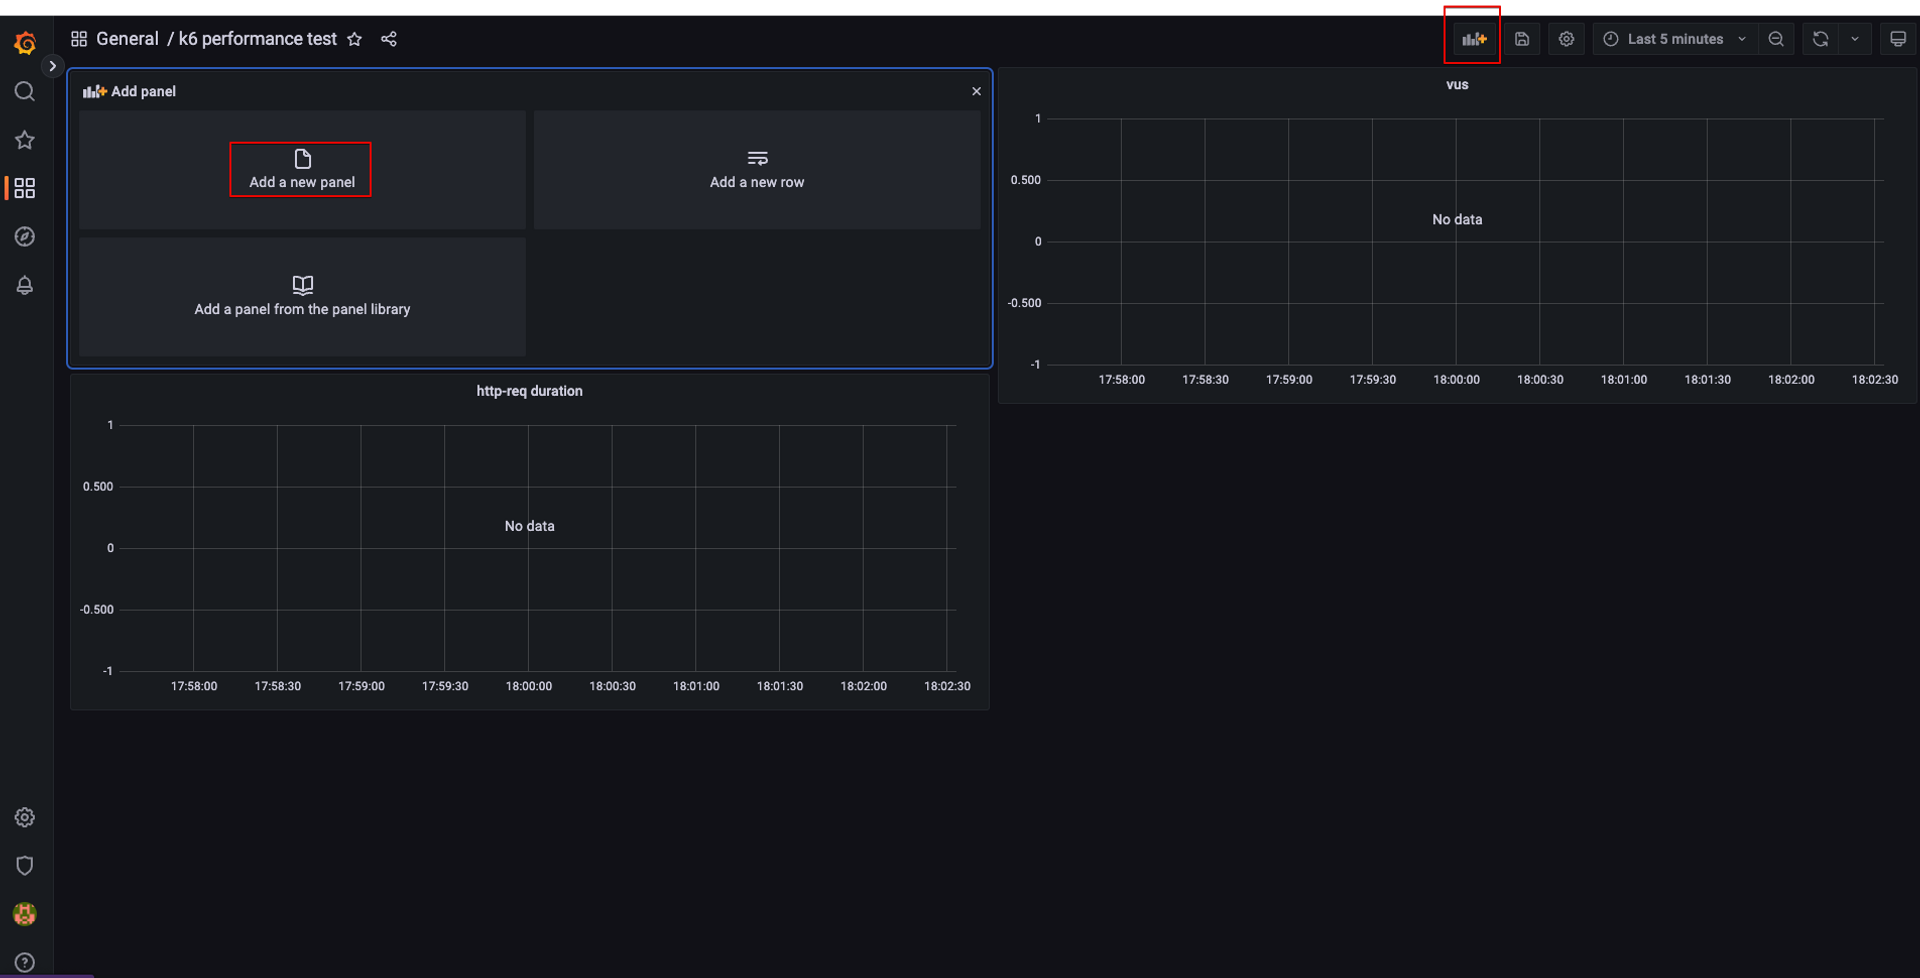
k6가 수집한 메트릭을 설정하면
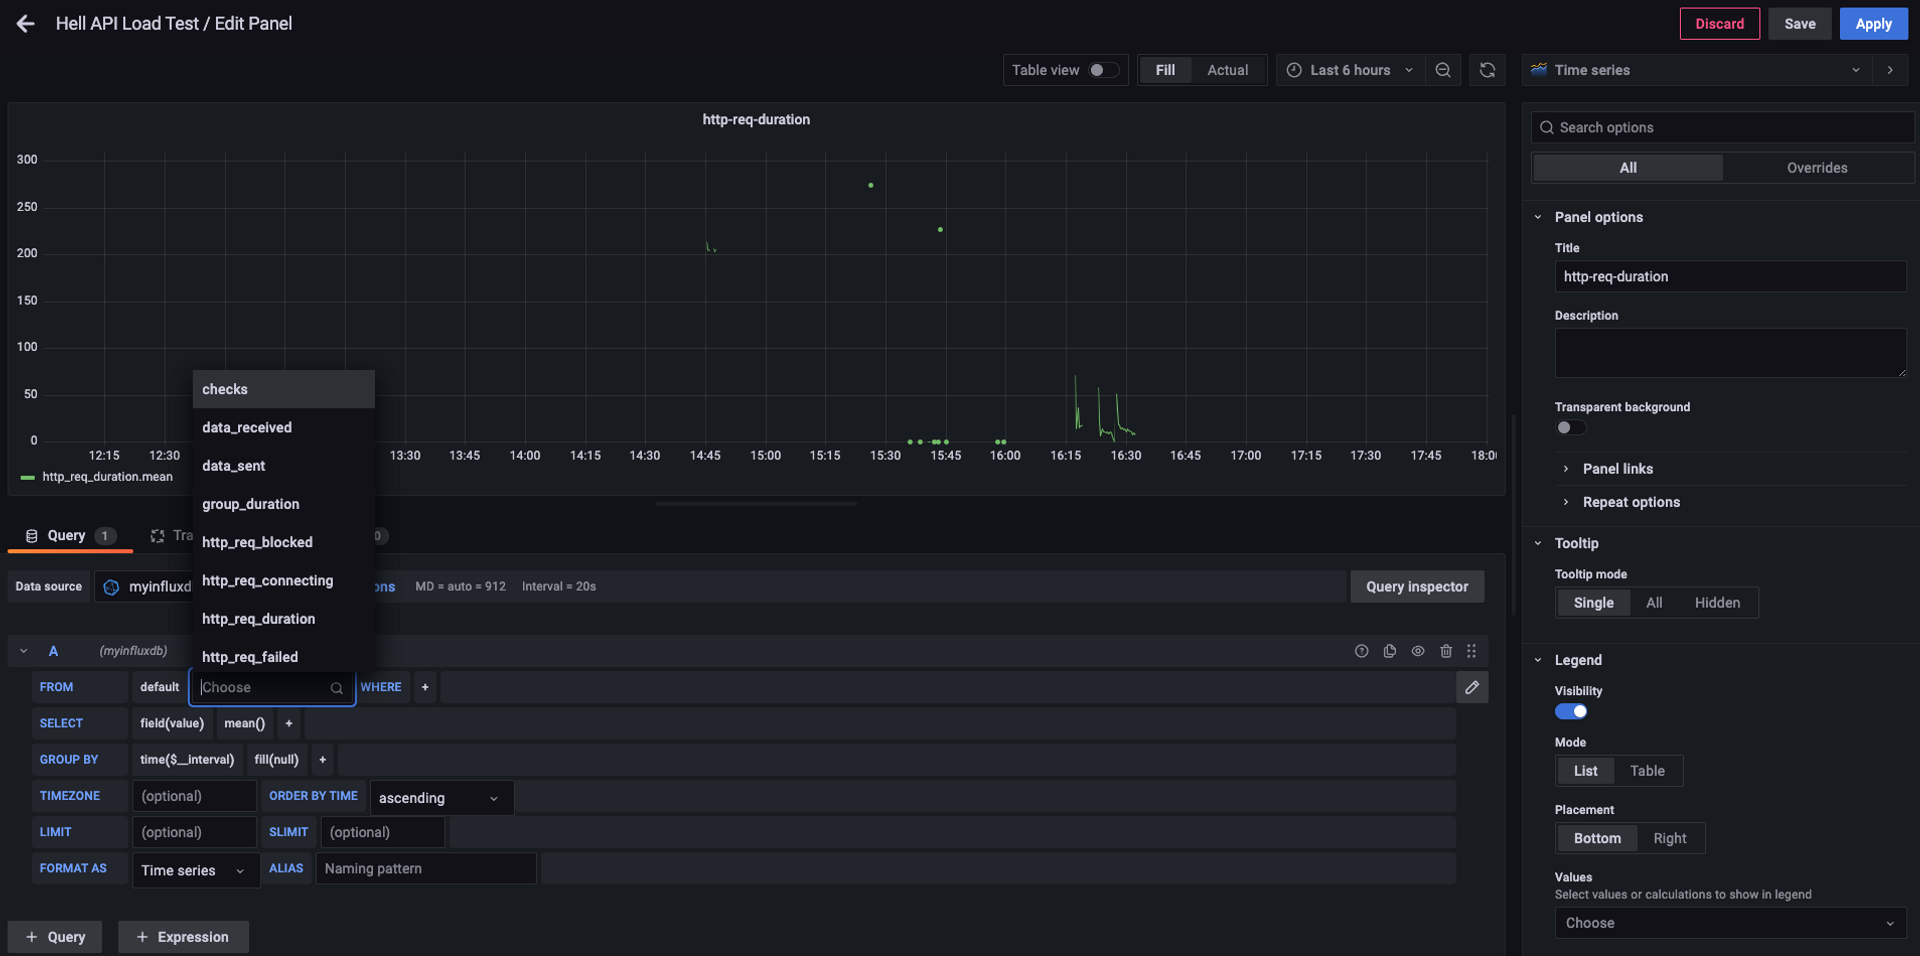
http-req duration 메트릭을 시계열 그래프로 Grafana에서 확인할 수 있습니다.
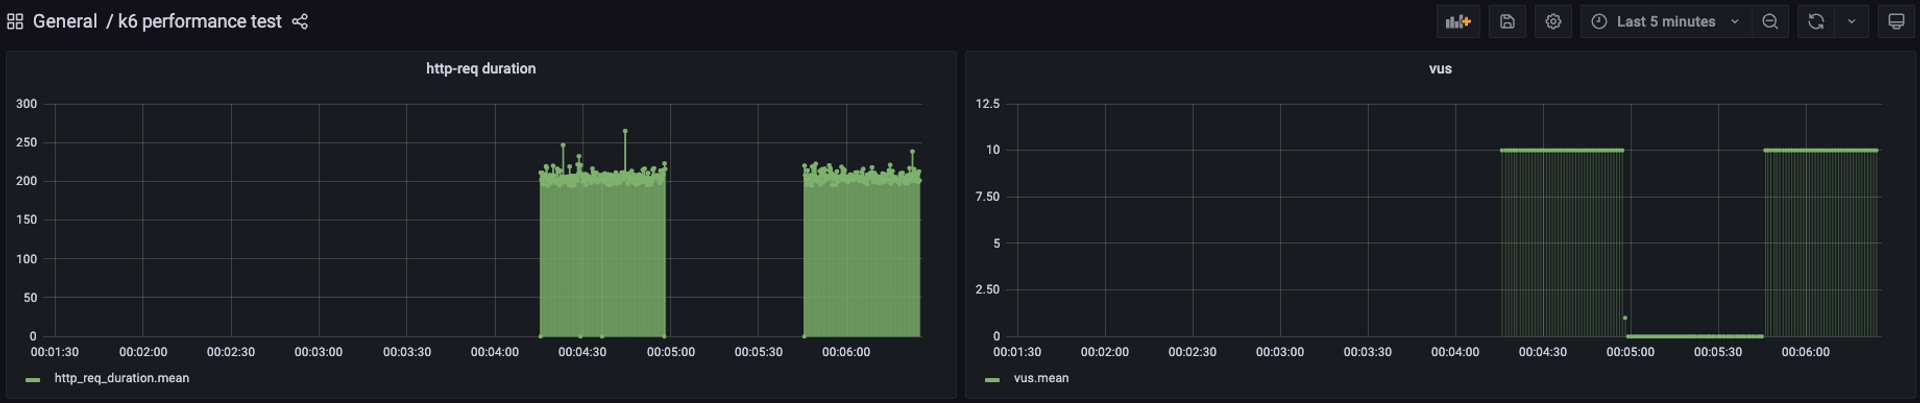
Dashboards | Grafana Labs
Spring Boot Actuator와 Grafana 연동
- jdk 17
- kotlin 1.7.22
- spring boot 3.0.3
Spring Boot Actuator 사용 이유
Spring Boot Actuator는 스프링 부트에서 제공하는 애플리케이션 모니터링 및 관리 기능입니다. 의존성만 추가해줘도 애플리케이션에 다양한 모니터링 지표를 확인할 수 있고 추가적인 설정으로 db, 서버 세부 상태, 프레임워크 상태를 확인할 수 있어 유용합니다. 자세한 설명은 공식 문서에서 확인할 수 있습니다.
Micrometer
Micrometer는 Datadog, Prometheus, Influx 등의 모니터링 시스템에게 지표를 전달하기 위해 표준화해주는 도구입니다. 우리는 Micrometer를 통해 spring boot actuator에서 수집한 메트릭 및 커스텀한 메트릭을 InfluxDB에 전달할 것입니다.
구현
우선 spring-boot-actuator와 influxdb으로 metric을 전송하여 연동을 도와주는 micrometer 라이브러리 의존성을 추가합니다.
implementation("org.springframework.boot:spring-boot-starter-actuator")
implementation("io.micrometer:micrometer-registry-influx")
이후에는 application.properties에 actuator, influxdb 관련 설정을 추가해줍니다. InfluxDB에 대한 properties path는 스프링 3.x 환경부터 일부 변경되었습니다.
# actuator 설정
management.endpoints.web.base-path=/actuator
management.endpoints.web.exposure.include=health, info, metrics

# influxdb
management.influx.metrics.export.db=spring-actuator
management.influx.metrics.export.enabled=true
management.influx.metrics.export.uri=http://127.0.0.1:8086
management.influx.metrics.export.auto-create-db=true

# 디버깅
logging.level.root=debug
이제 간단한 CRUD RestController를 만들어줍니다. 아까 학습한 custom metrics로 각 엔드포인트마다 간단하게 counting을 해주겠습니다.
package com.eastperson.k6example.api

import io.micrometer.core.instrument.Counter
import io.micrometer.core.instrument.MeterRegistry
import org.springframework.web.bind.annotation.DeleteMapping
import org.springframework.web.bind.annotation.GetMapping
import org.springframework.web.bind.annotation.PathVariable
import org.springframework.web.bind.annotation.PostMapping
import org.springframework.web.bind.annotation.PutMapping
import org.springframework.web.bind.annotation.RequestMapping
import org.springframework.web.bind.annotation.RestController

@RestController
@RequestMapping("/hello")
class HelloController(
    private val meterRegistry: MeterRegistry
) {
    private val getCounter: Counter = meterRegistry.counter("my.get.counter")
    private val postCounter: Counter = meterRegistry.counter("my.post.counter")
    private val putCounter: Counter = meterRegistry.counter("my.put.counter")
    private val deleteCounter: Counter = meterRegistry.counter("my.delete.counter")

    @GetMapping
    fun get(name: String?): String {
        getCounter.increment()
        return "get, ${name}!!"
    }

    @PostMapping
    fun post(): String {
        postCounter.increment()
        return "post!!"
    }

    @PutMapping("/{id}")
    fun put(@PathVariable id: String): String {
        putCounter.increment()
        return "put, ${id}!!"
    }

    @DeleteMapping("/{id}")
    fun delete(@PathVariable id: Long): String {
        deleteCounter.increment()
        return "delete, ${id}!!"
    }
}
스프링 애플리케이션을 실행시키면 아래와 같은 로그가 나와야 합니다.
2023-02-26T14:47:00.034+09:00 DEBUG 46954 --- [trics-publisher] i.micrometer.influx.InfluxMeterRegistry  : influx database spring-actuator is ready to receive metrics

.
.
.

2023-02-26T14:47:00.082+09:00 DEBUG 46954 --- [trics-publisher] i.micrometer.influx.InfluxMeterRegistry  : successfully sent 114 metrics to InfluxDB.
influxDB는 2.x 이후로 influxDB UI라는 굉장히 유용한 기능을 제공합니다. 하지만 k6는 아직 2.x 버전의 influxdb와 연동이 되지 않아 k6 공식 리포지토리의 docker-compose도 1.8버전의 influxdb 를 사용합니다. 1.x influxdb는 influxdb-cli로 db에 접근해서 데이터를 확인해야 합니다. 저희는 docker-compose를 이용해서 설치를 했으니 아래와 같은 방식으로 확인을 해줍니다.
docker ps
--
CONTAINER ID IMAGE COMMAND CREATED STATUS PORTS NAMES
0ee7cefd30a8 grafana/grafana:latest "/run.sh" 7 minutes ago Up 7 minutes 0.0.0.0:3000->3000/tcp k6_grafana_1
--
docker exec -it 12197416ad65 influx
show databases
ues spring-actuator
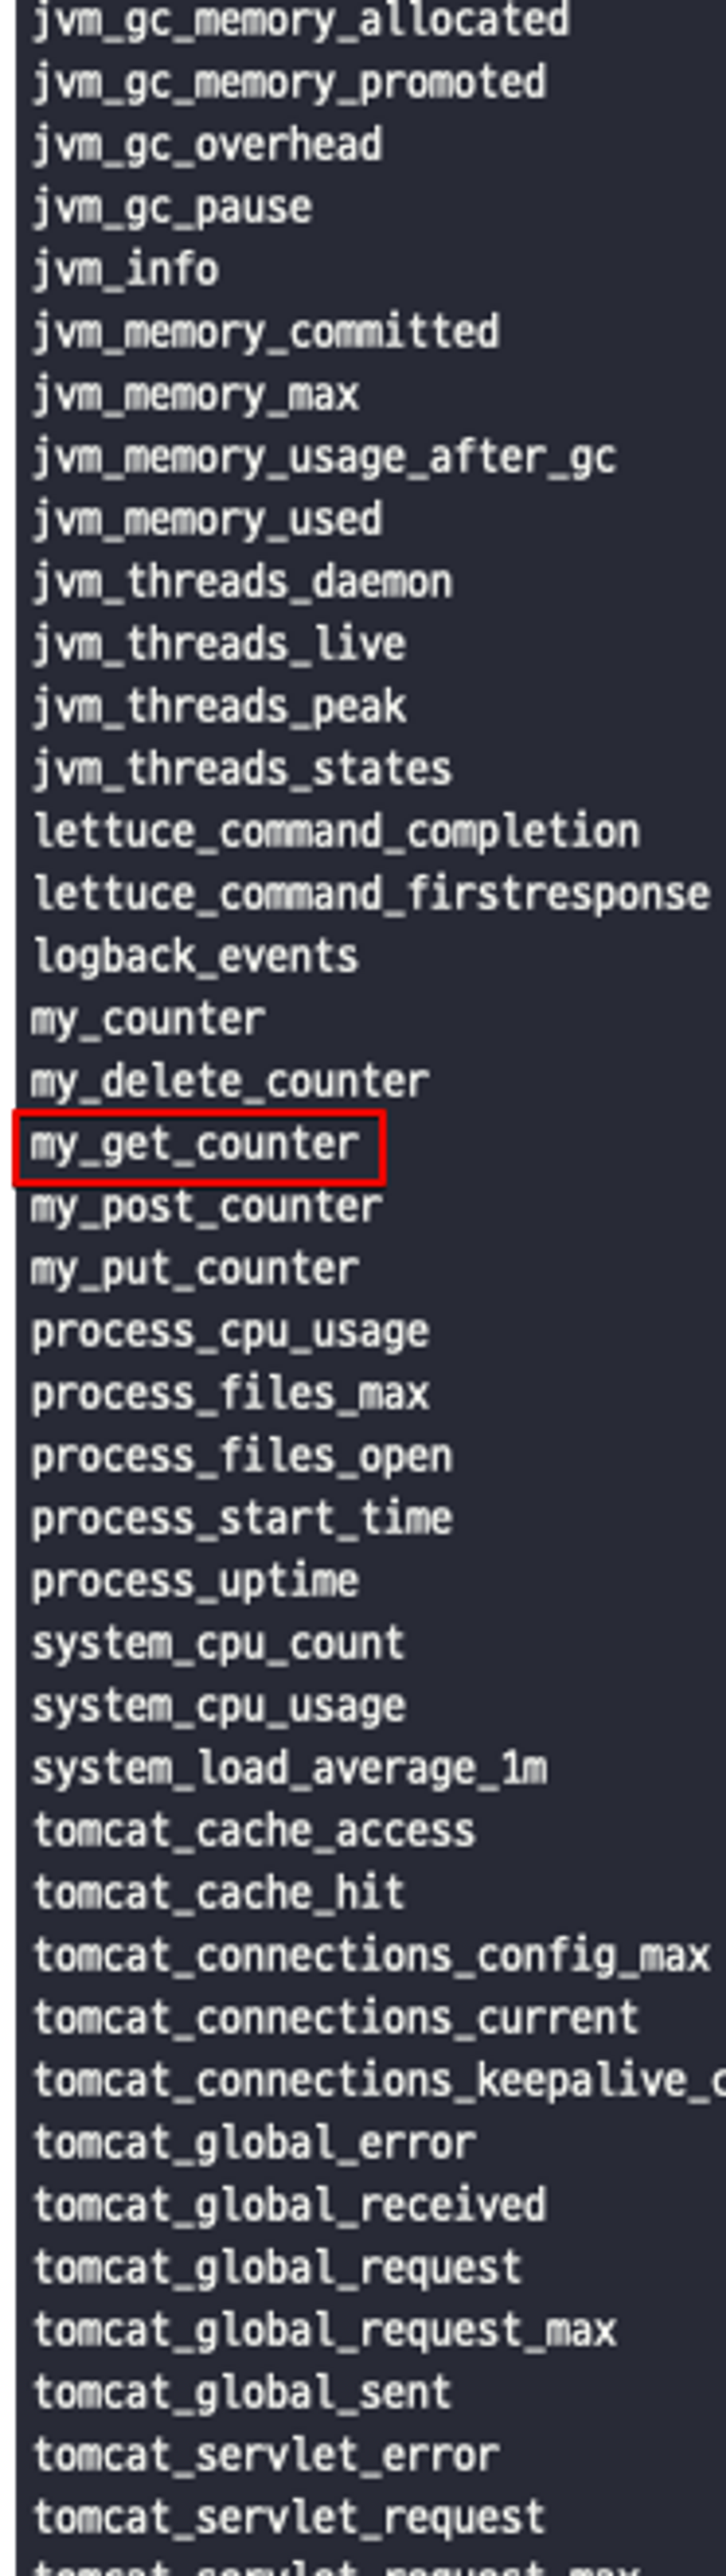
show measurements
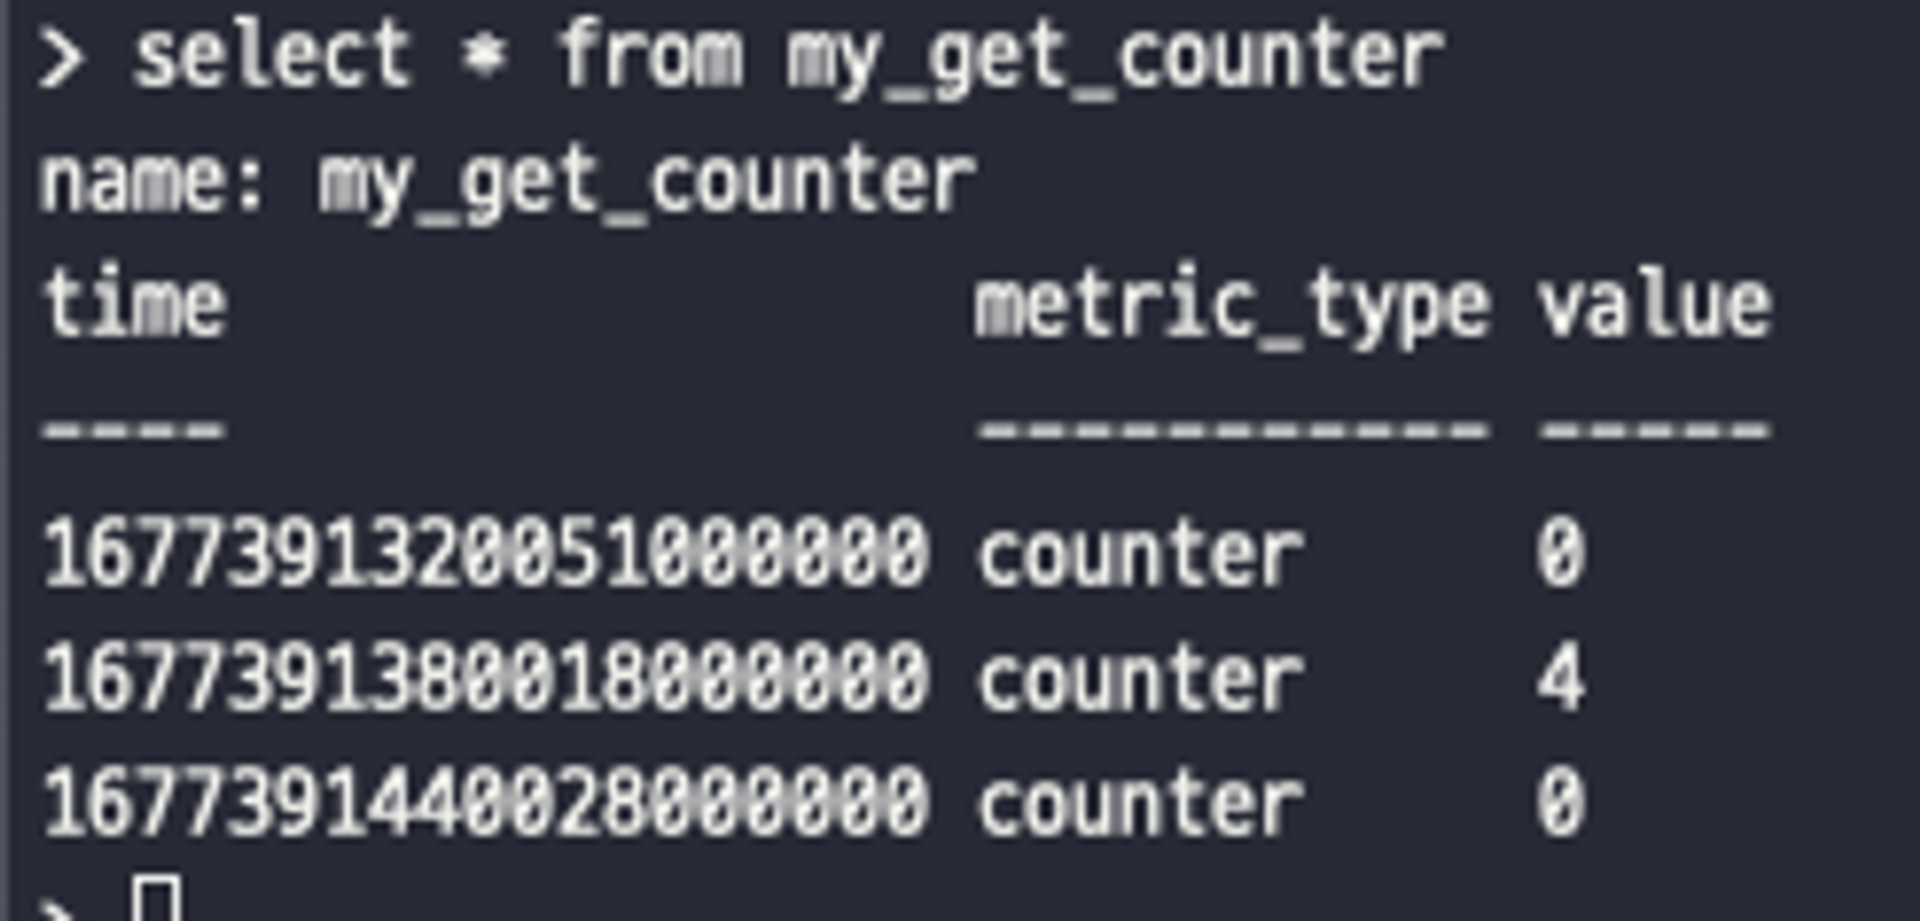
select * from my_get_counter아래와 같이 메트릭이 리스트의 형태로 나타납니다.
저는 테스트를 위해 http://127.0.0.1:8080/hello?name=ep 요청을 4번 해줬습니다. spring과 influxdb 연동이 잘된 것을 확인할 수 있습니다.
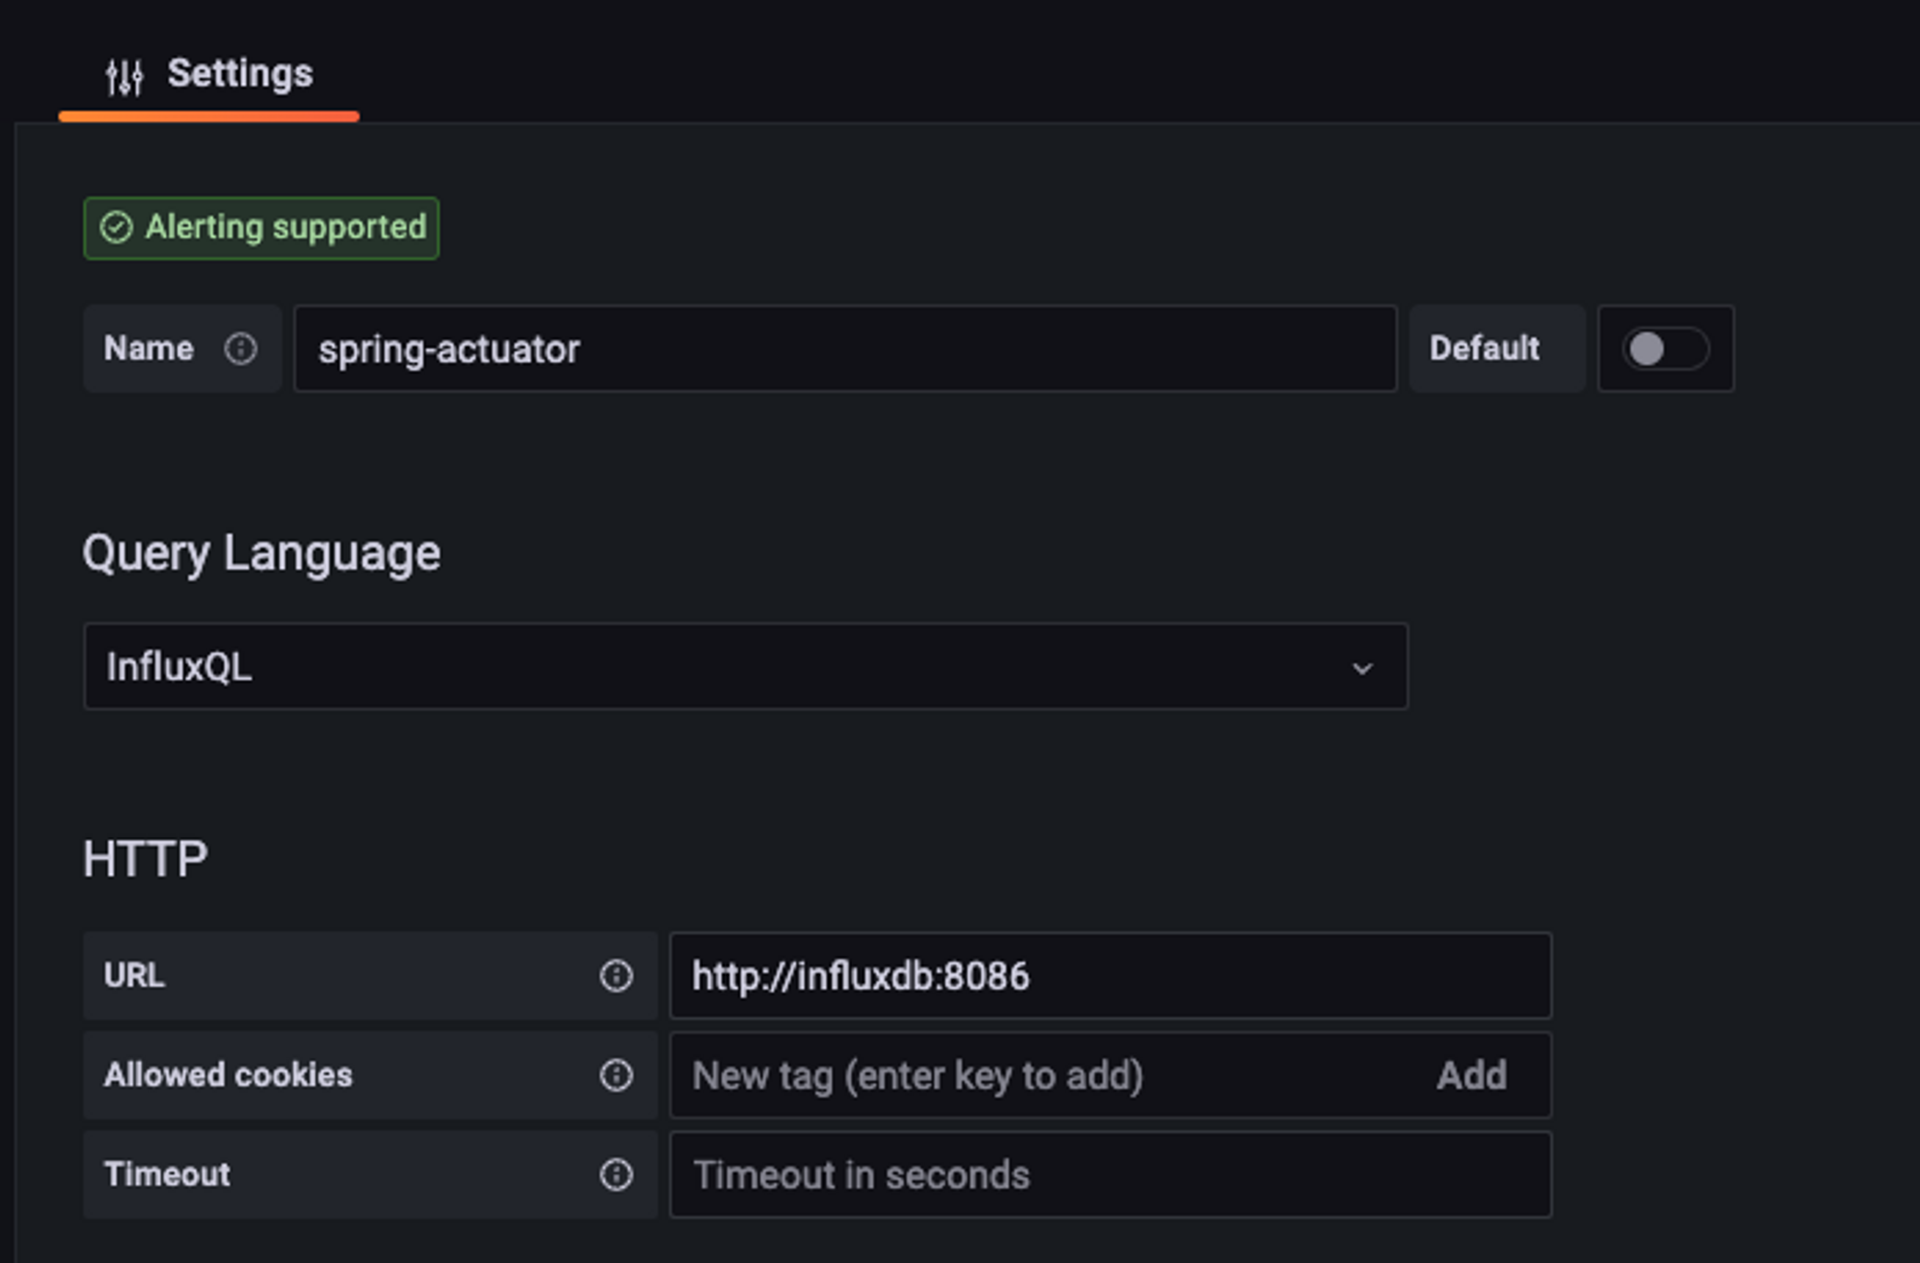
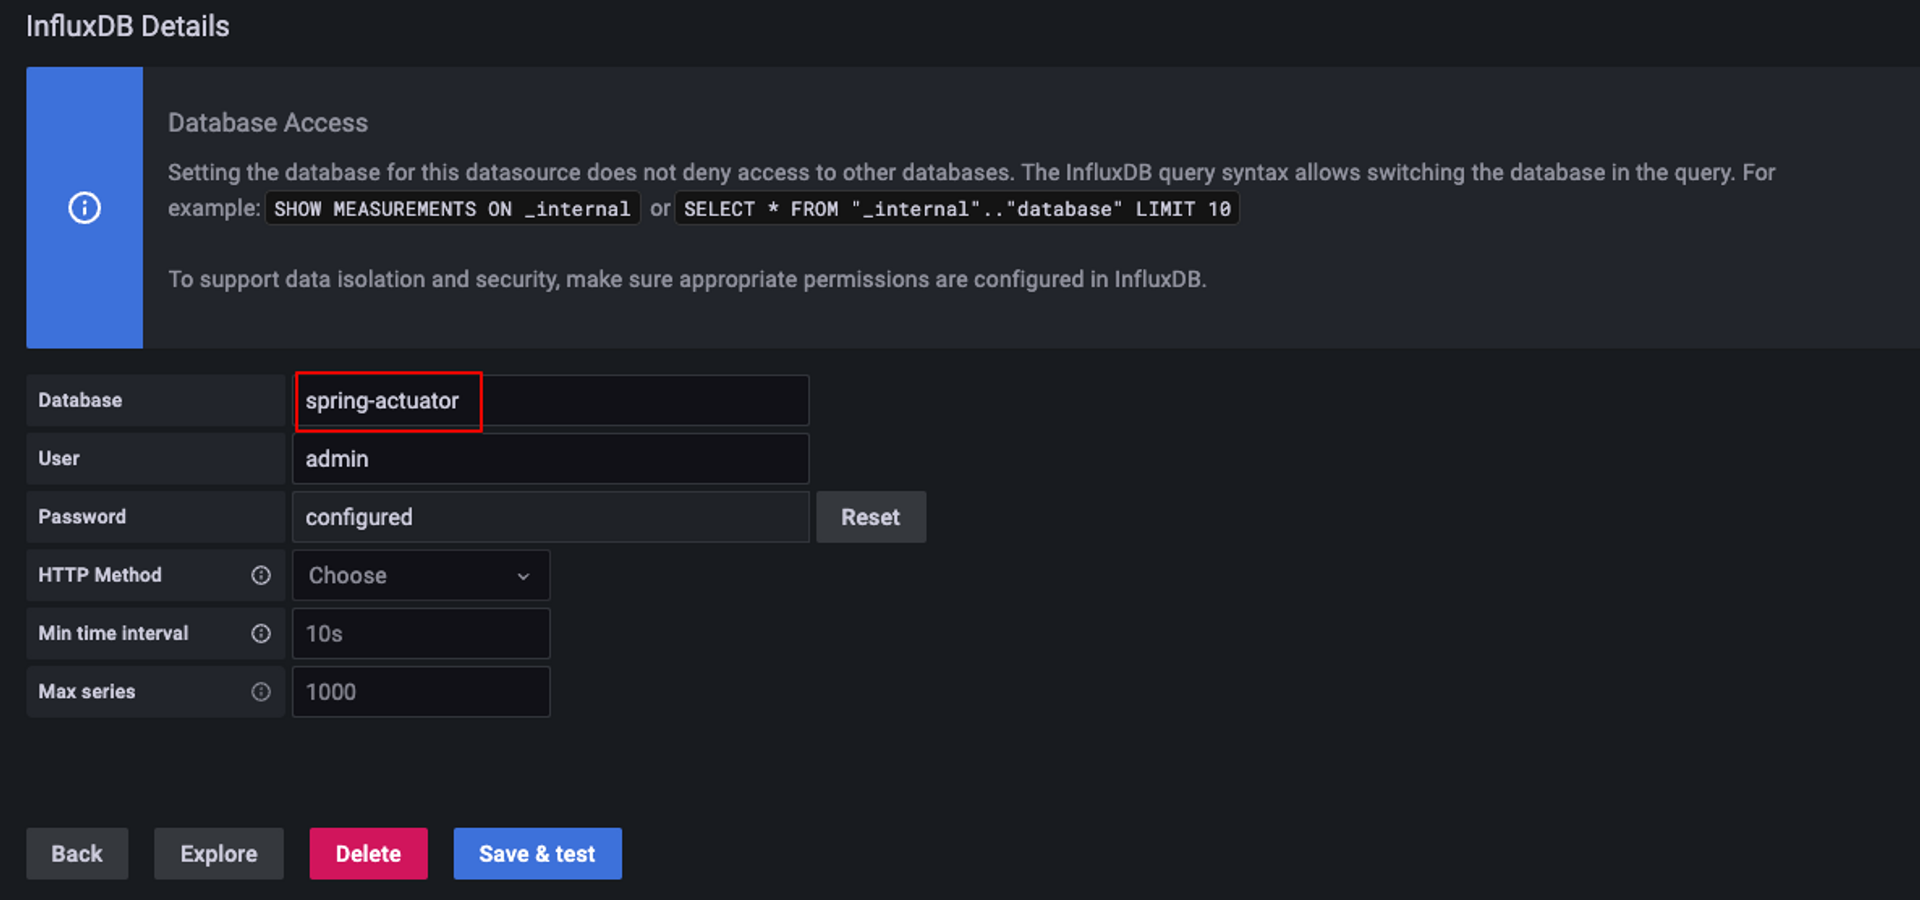
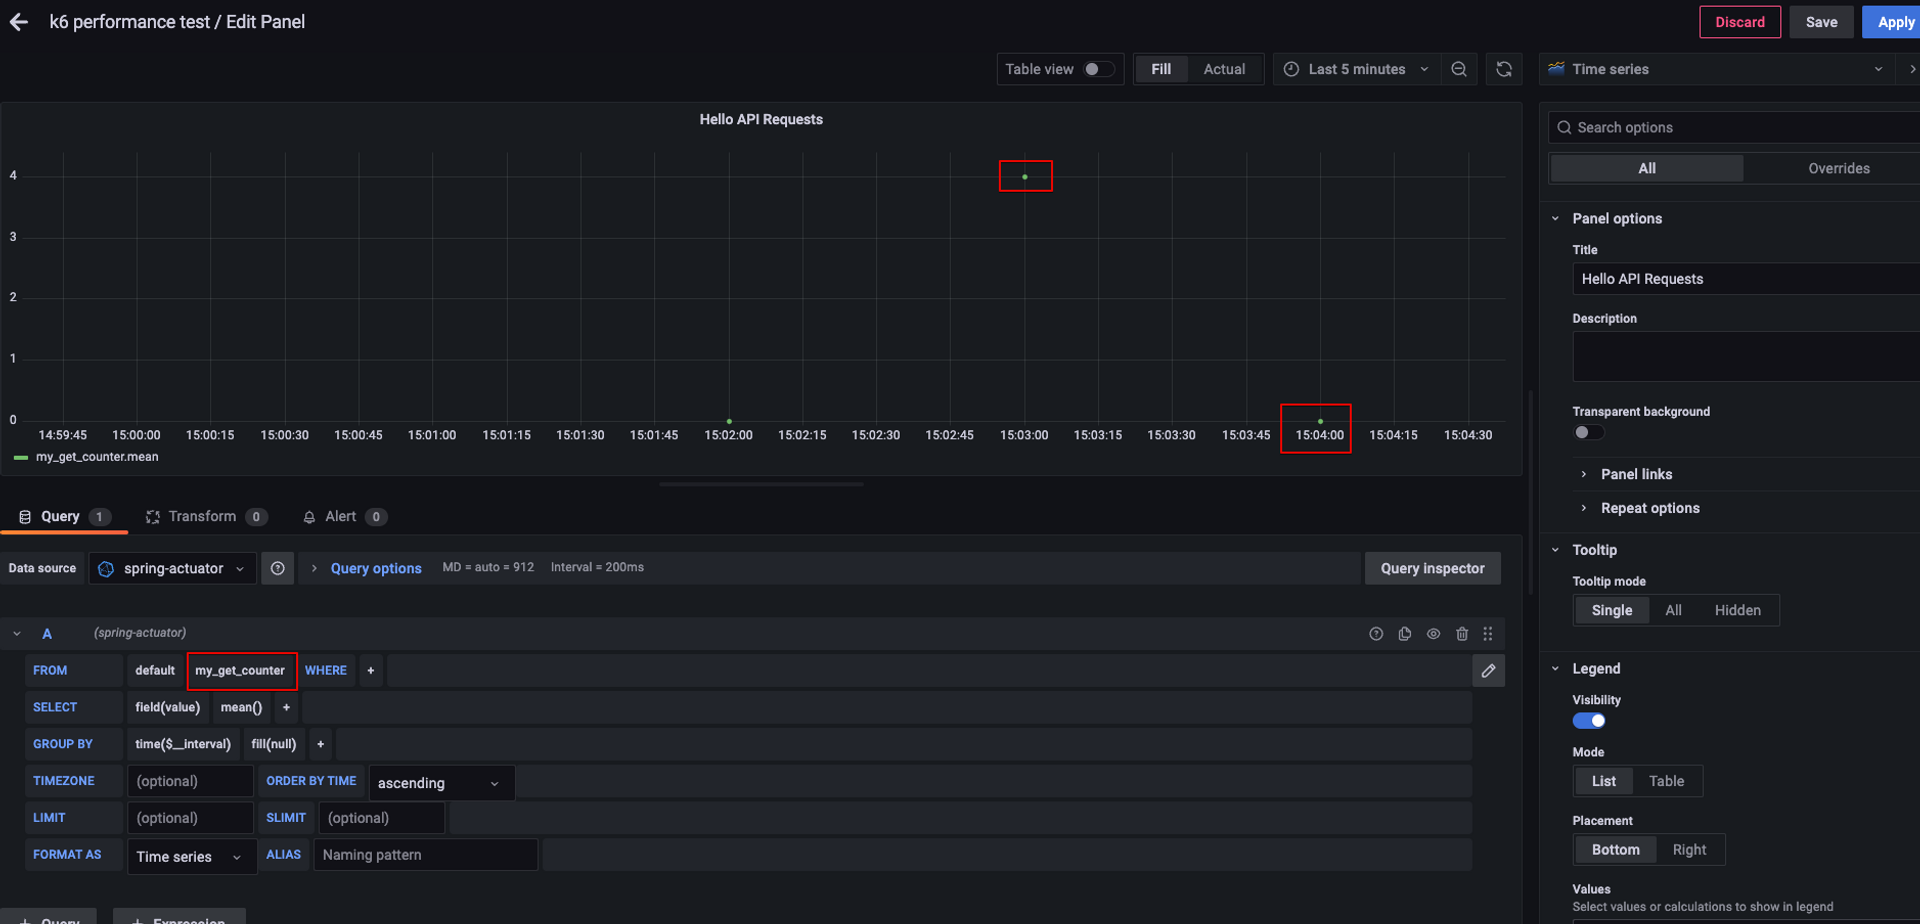
Grafana와 Spring에서 생성한 InfluxDB와 연동을 시켜줍니다.
그러면 아래와 같이 Grafana에서 우리가 보낸 메트릭을 확인할 수 있습니다. 현재 1분에 1번 metric을 보내기 때문에 다음과 같이 나옵니다.
최종 테스트
application.properties
# actuator 설정
management.endpoints.web.base-path=/actuator
management.endpoints.web.exposure.include=health, info, metrics

# influx db
management.influx.metrics.export.db=spring-actuator
management.influx.metrics.export.enabled=true
management.influx.metrics.export.uri=http://127.0.0.1:8086
management.influx.metrics.export.auto-create-db=true
management.influx.metrics.export.consistency=one
management.influx.metrics.export.step=5s

# 디버깅
server.tomcat.mbeanregistry.enabled=true
logging.level.root=debug
http-request-sample-final.js
import { check, group, sleep } from "k6";
import http from "k6/http";

export let options = {
	max_vus: 100,
	vus: 100,
	stages: [
		{ duration: "1m", target: 30 },
		{ duration: "2m", target: 40 },
		{ duration: "1m", target: 50 },
	],
};

export default function () {
	group("hello-api-test", function () {
		group("get request", function () {
			let res = http.get(
				"http://host.docker.internal:8080/hello?name=ep"
			);
			check(res, { "status is 200": (r) => r.status === 200 });
			sleep(1);
		});

		group("post request", function () {
			let res = http.post("http://host.docker.internal:8080/hello");
			check(res, { "status is 200": (r) => r.status === 200 });
			sleep(2);
		});

		group("put request", function () {
			let res = http.put("http://host.docker.internal:8080/hello/1");
			check(res, { "status is 200": (r) => r.status === 200 });
			sleep(3);
		});

		group("delete request", function () {
			let res = http.del("http://host.docker.internal:8080/hello/1");
			check(res, { "status is 200": (r) => r.status === 200 });
			sleep(4);
		});
	});
}
Docker Container에서 host를 지정하지 않았기 때문에
localhost→host.docker.internal로 변경해줘야 통신을 할 수 있습니다.
docker-compose run -v $PWD:/scripts k6 run /scripts/http-request-sample-final.js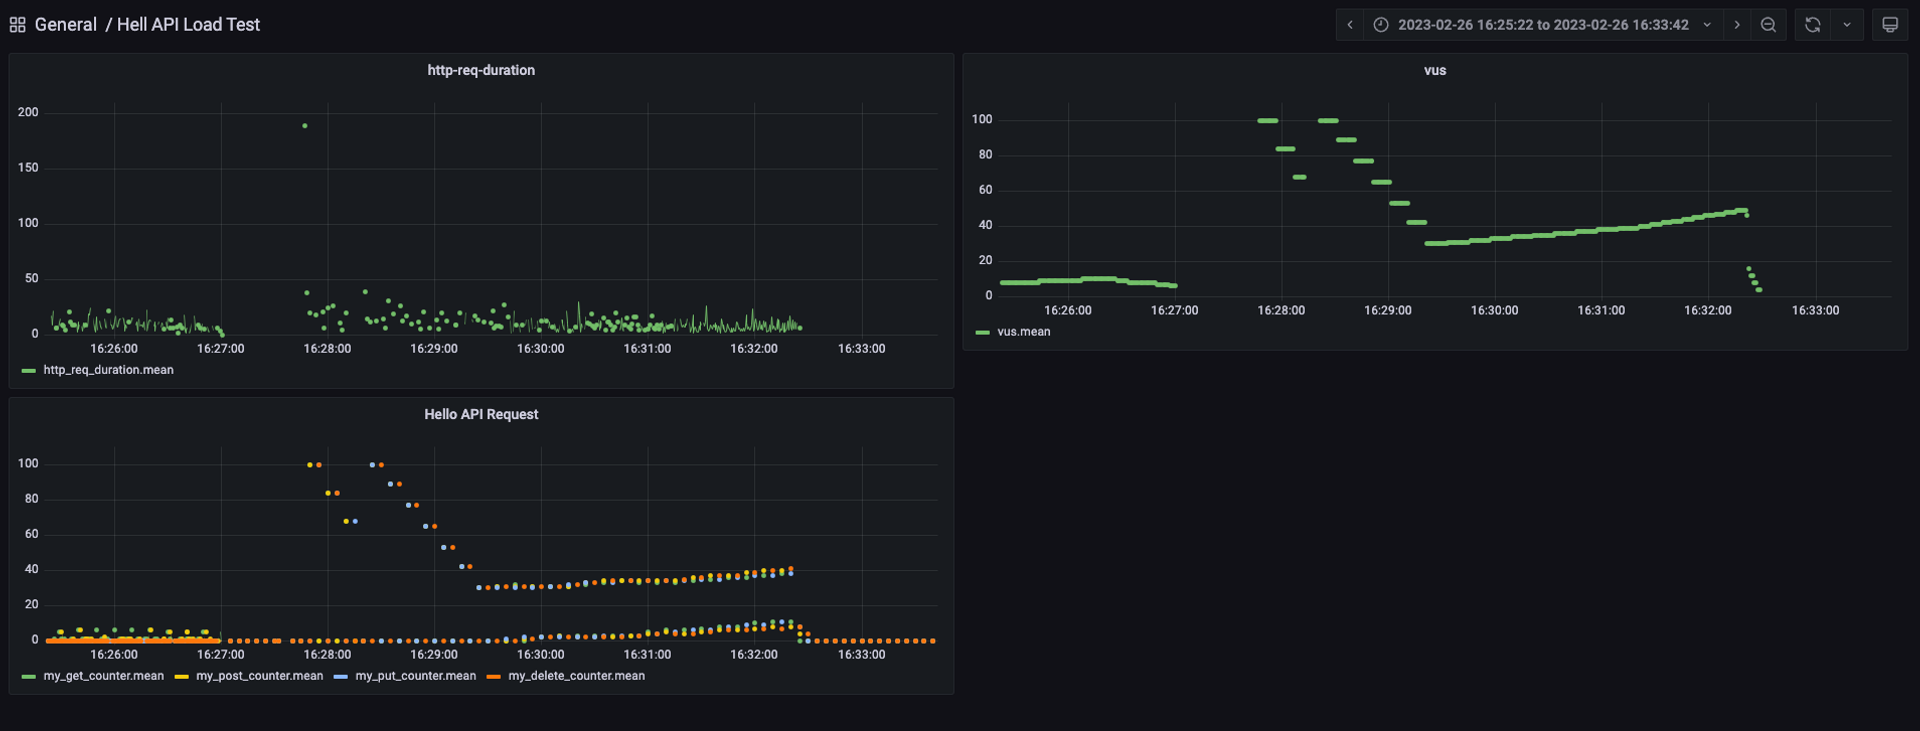
테스트 메트릭에 대한 이해도가 낮아 예상했던 시나리오의 결과는 나오지 않았습니다 😅
Grafana에서 요청온 메트릭을 확인할 수 있었습니다. actuator와 k6에서 제공하는 다양한 메트릭과 함께 custom 메트릭을 설정하면 애플리케이션과 테스트 메트릭을 함께 확인할 수 있습니다.
이 글에서는 테스트를 기획하고 시나리오를 만들어 목표한 메트릭을 측정하고 대응하는 내용은 담지 않고 있습니다. 잘 정리된 글이 있으니 추가적인 테스트를 해보고 싶은 분들은 참조하시면 좋을 것 같습니다.

안녕하세요! 너무 잘 참고하고 있습니다. 다름이 아니라 해당 부분에 어려움이 있어서 댓글을 남깁니다.
JS 파일을 만들어서 cd k6 한 디렉토리에서 해당 파일을 위치시키고 해당 명령어
docker-compose run -v $PWD:/scripts k6 run /scripts/http-request-sample-final.js 하려는데 계속 해당 에러가 뜹니다.
ERRO[0000] The moduleSpecifier "/scripts/http-request-sample-final.js" couldn't be found on local disk. Make sure that you've specified the right path to the file. If you're running k6 using the Docker image make sure you have mounted the local directory (-v /local/path/:/inside/docker/path) containing your script and modules so that they're accessible by k6 from inside of the container, see https://k6.io/docs/using-k6/modules#using-local-modules-with-docker.
많이 구글링을 해봤는데 정답이 안나와서 댓글을 남깁니다. k6 디렉토리에서 ls을 사용하면 해당 파일 http-request-sample-final.js가 있는데 무슨 문제가 있는것일까요?