import pandas as pd
import matplotlib.pyplot as plt
import matplotlib
import matplotlib.font_manager as fm
import os
import seaborn as sns
from IPython.display import display
import numpy as np
import re
import json


pd.options.display.max_columns = None
%matplotlib inline

# 한글 폰트
plt.rcParams['font.family'] = 'NanumGothic'
# 마이너스 깨짐 방지
matplotlib.rcParams['axes.unicode_minus'] = False

# 나눔 폰트 경로 설정
font_path = '/usr/share/fonts/truetype/nanum/NanumGothic.ttf'  # 나눔 고딕의 경로
font_prop = fm.FontProperties(fname=font_path).get_name()

# 한글 폰트 설정}
matplotlib.rcParams['font.family'] = font_prop

# 전역 팔레트 설정 (예: 'Set2' 팔레트 사용)
sns.set_palette('Set2')
# 데이터 불러오기
regular_season = pd.read_csv('../datas/Regular_Season_Batter.csv')
'''
포지션, 타수별 OPS의 관계를 알아보자
'''
regular_season['position']0 내야수(우투우타)
1 내야수(우투좌타)
2 내야수(우투좌타)
3 내야수(우투좌타)
4 내야수(우투좌타)
...
2449 내야수(우투양타)
2450 내야수(우투양타)
2451 내야수(우투양타)
2452 내야수(우투양타)
2453 내야수(우투양타)
Name: position, Length: 2454, dtype: object# 포지션, 타수 분리
regular_season['pos'] = regular_season['position'].apply(lambda x: x.split('(')[0])
regular_season['hand'] = regular_season['position'].apply(lambda x: x.split('(')[1].replace(')', '')[2:])
regular_season.to_csv('../datas/Regular_Season_Batter.csv', encoding='utf-8-sig', index=False)
regular_season[['pos', 'hand']]| pos | hand | |
|---|---|---|
| 0 | 내야수 | 우타 |
| 1 | 내야수 | 좌타 |
| 2 | 내야수 | 좌타 |
| 3 | 내야수 | 좌타 |
| 4 | 내야수 | 좌타 |
| ... | ... | ... |
| 2449 | 내야수 | 양타 |
| 2450 | 내야수 | 양타 |
| 2451 | 내야수 | 양타 |
| 2452 | 내야수 | 양타 |
| 2453 | 내야수 | 양타 |
2454 rows × 2 columns
plt.figure(figsize=(20,9))
plt.subplot(1,2,1)

# 포지션별 OPS
ax = sns.boxplot(x='pos', y='OPS', data=regular_season, showfliers = False)
plt.title('포지션별 OPS')
# 포지션별 중앙값
median = regular_season.groupby('pos')['OPS'].median().to_dict()

# 박스 중앙에 글자 표시
for patch in ax.get_xticklabels():
    ax.text(patch.get_text(), median[patch.get_text()] + 0.03, f'Median: {median[patch.get_text()]:.1f}',
            ha='center', va='center', fontsize=15, color='white')


plt.subplot(1,2,2)
ax = sns.boxplot(x='hand', y = 'OPS', data = regular_season, showfliers = False)
plt.title('타석 방향별 OPS')
# 타석 방향별 중앙값
median = regular_season.groupby('hand')['OPS'].median().to_dict()

# 박스 중앙에 글자 표시
for patch in ax.get_xticklabels():
    ax.text(patch.get_text(), median[patch.get_text()] + 0.03, f'Median: {median[patch.get_text()]:.1f}',
            ha='center', va='center', fontsize=15, color='white')


plt.show()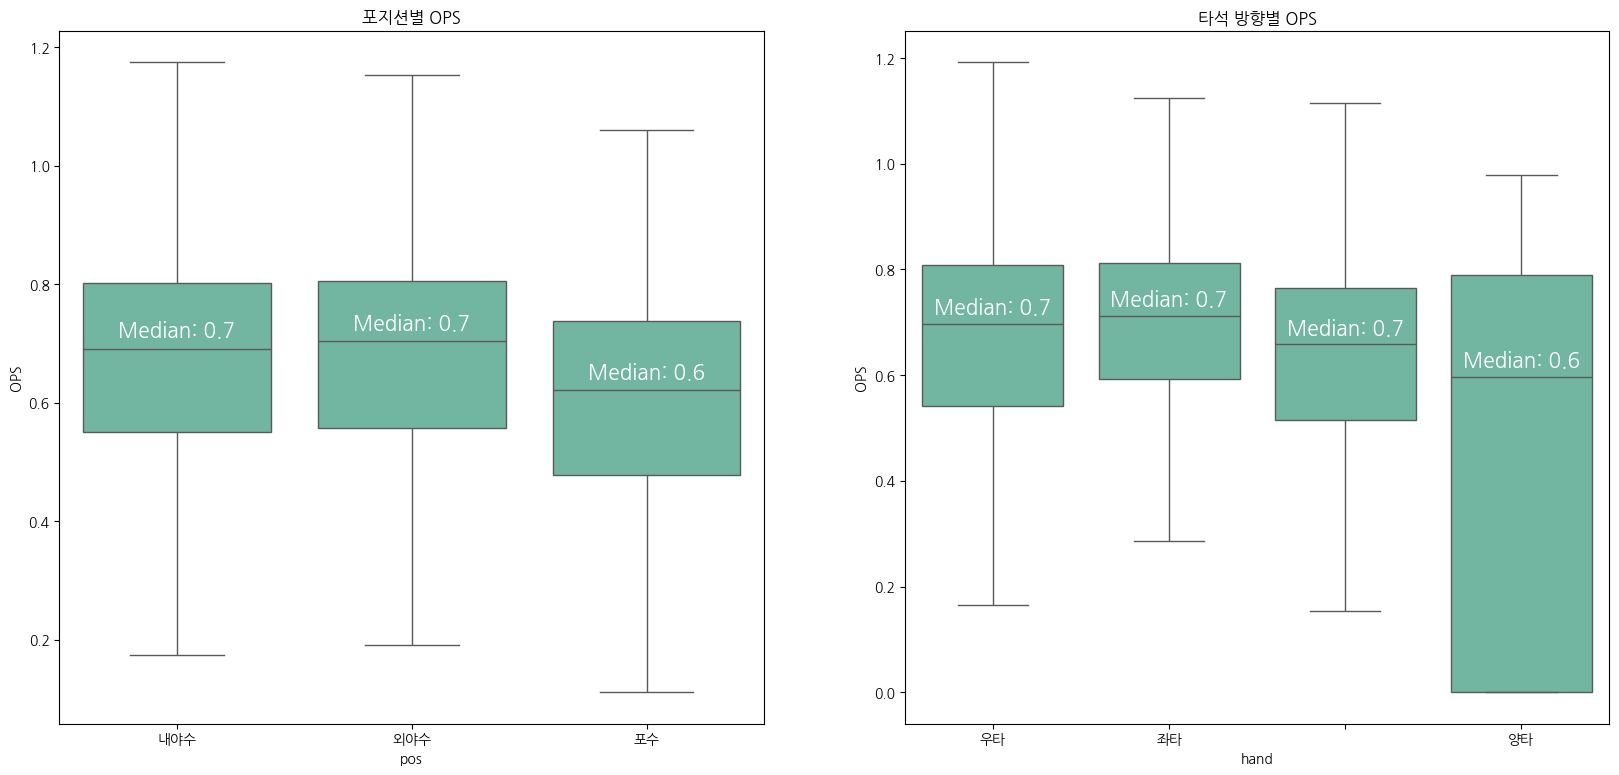

코딩 공부하는 사람