⚡ Tick - time, major 옵션
npm install
npm install date-fns chartjs-adapter-date-fns@next --saveimport
import { Chart } from 'chart.js';
import 'chartjs-adapter-date-fns';
code
const options = {
responsive: true,
plugins: {
title: {
display: true,
text: 'Line Chart'
}
},
scales: {
x: {
type: 'time',
display: true,
title: {
display: true
// text: 'Date'
},
ticks: {
major: {
enabled: true
},
callback: (value, index, values) => {
return values[index].major ? value : '';
},
font: (context) => {
// console.log(context.tick && context.tick.major);
const boldedTicks = context.tick && context.tick.major ? 'bold' : '';
return { weight: boldedTicks };
}
}
},
y: {
display: true,
title: {
display: true,
text: 'value'
}
}
}
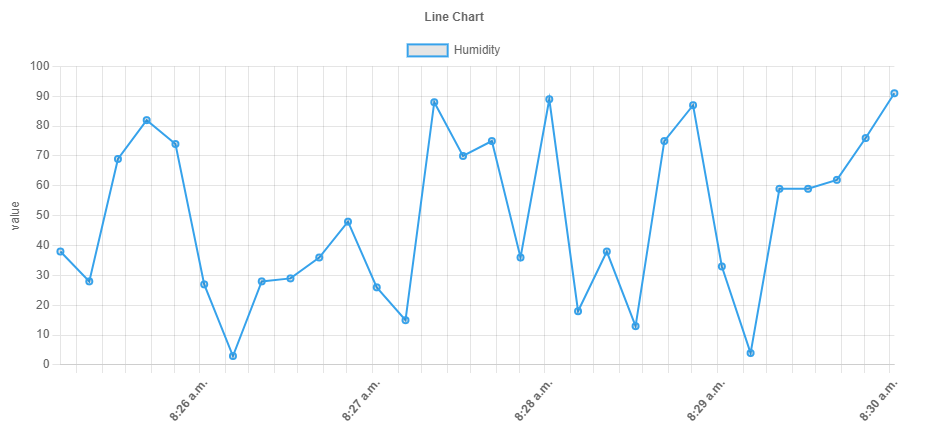
};결과
실제 항목의 라벨과 상관없이 시간이 표시됨.
major tick만 표시되고, minor tick은 표시되지 않음.
참조
https://jsrepos.com/lib/chartjs-chartjs-adapter-date-fns
https://www.youtube.com/watch?v=fghycmP6Vuw
https://stackoverflow.com/questions/49313954/different-major-tick-format-in-chart-js
⚡ Zoom 기능 추가
npm install
npm install chartjs-plugin-zoomimport
import { Chart } from 'chart.js';
import zoomPlugin from 'chartjs-plugin-zoom';

Chart.register(zoomPlugin);
code
plugins에 zoom 옵션 추가
		const options = {
        responsive: true,
        plugins: {
            title: {
                display: true,
                text: 'Line Chart'
            },
            zoom: {
                pan: { // 마우스로 잡아서 그래프 이동
                    enabled: true,
                    mode: 'x'
                },
                zoom: {
                    wheel: {
                        enabled: true
                    }
                }
            }
        }
    };
참조
https://www.chartjs.org/chartjs-plugin-zoom/latest/guide/integration.html
https://www.youtube.com/watch?v=_hKcXeB-geM
⚡ No Data 표시하기
데이터가 없는 경우 No Data 문구를 표시할 수 있다. custom 디자인을 해도 된다.
const plugins = [
  {
    afterDraw: function (chart) {
      console.log(chart);
      if (chart.data.datasets[0].data.length < 1) {
        let ctx = chart.ctx;
        let width = chart.width;
        let height = chart.height;
        ctx.textAlign = "center";
        ctx.textBaseline = "middle";
        ctx.font = "30px Arial";
        ctx.fillText("No data to display", width / 2, height / 2);
        ctx.restore();
      }
    },
  },
];

<Line height={120} data={props.data} options={options} plugins={plugins} />
https://stackoverflow.com/questions/55564508/pie-chart-js-display-a-no-data-held-message

Web Developer