
시스템이나 데이터베이스 등의 모니터링을 위하여 Prometheus + Grafana를 설치해 보려고 한다. 이번 글에서는 우선 Prometheus만 Docker를 사용하여 설치하는 과정을 작성했다.
참고 문서
https://prometheus.io/docs/prometheus/latest/installation/
https://prometheus.io/docs/prometheus/latest/configuration/configuration/
https://hub.docker.com/r/prom/prometheus
Prometheus는 Exporter의 export url로부터 지속적으로 데이터를 수집하면서 데이터를 보관하는데, 때문에 어떤 url에서 어떤 주기로 데이터를 수집할 것인지 등을 사전에 정의해야 한다.
이번에 사용한 config 파일은 아래와 같다.
# prometheus.yml
global:
  scrape_interval:     15s
  evaluation_interval: 15s

scrape_configs:
  - job_name: 'prometheus'
    static_configs:
- targets: ['localhost:9090']-
global (Prometheus 전체에 반영)
scrape_interval : 타겟으로부터의 데이터 추출 간격 (기본값 1분)
evaluation_interval : 데이터를 증분 시킬 간격. scrape interval과 동일한 값으로 설정하는 것이 보편적인 것 같다 (기본값 1분) -
scrape_configs (수집할 데이터와 그와 관련된 설정)
job_name : 수집 job 이름
static_configs > targets : 수집 URL
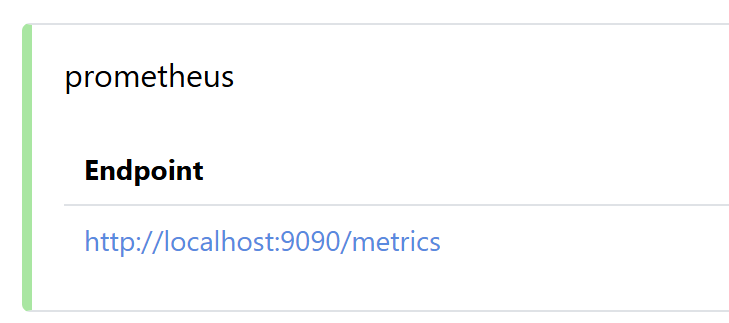
job_name ~ targets 부분은 exporter 개수에 맞춰 입력하면 되며, 아래 이미지처럼 카드 형태로 Prometheus에서 조회 가능하다.
config 작성이 완료되었다면 아래 명령어로 prometheus를 실행해 보자. 백그라운드에서 실행되는 -d 명령어나, 시스템 재부팅 시 자동 시작 여부를 결정하는 --restart 명령어는 필요에 따라 수정하여 사용하면 된다.
docker run -d \
        --restart=unless-stopped \
        -p 9090:9090 \
        -v /prometheus/prometheus.yml:/etc/prometheus/prometheus.yml \
        prom/prometheus
docker image는 prom/prometheus를 사용했다.
포트나, config 경로 부분은 각자 맞춰서 수정하여 사용하면 된다. 콜론 기준으로 앞이 호스트의 포트나 경로(변경 가능), 뒷부분이 컨테이너의 포트나 경로(변경 어려움) 임을 유의하자.
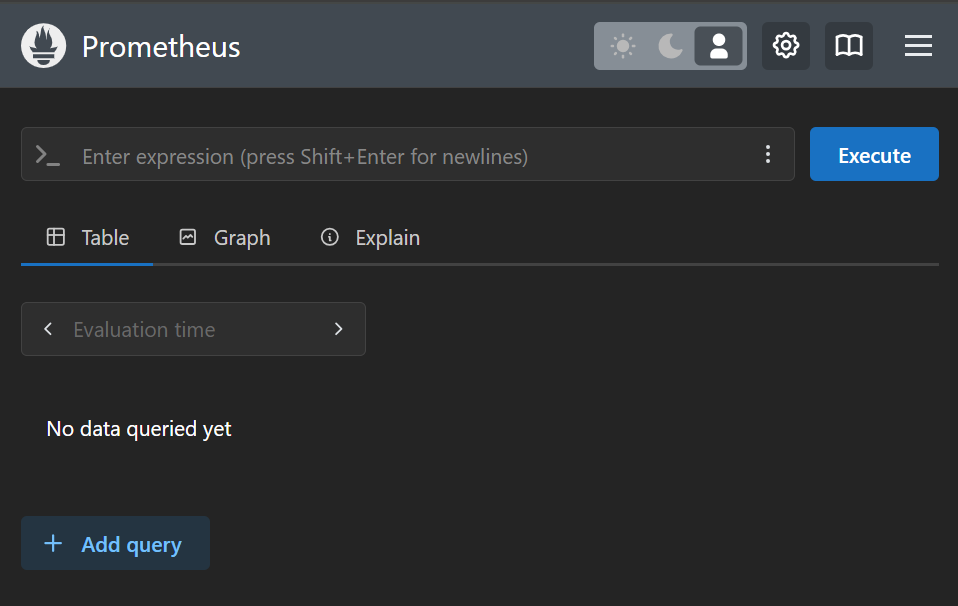
정상적으로 실행되었다면 localhost:9090에서 Prometheus의 Web UI에 접속할 수 있다.
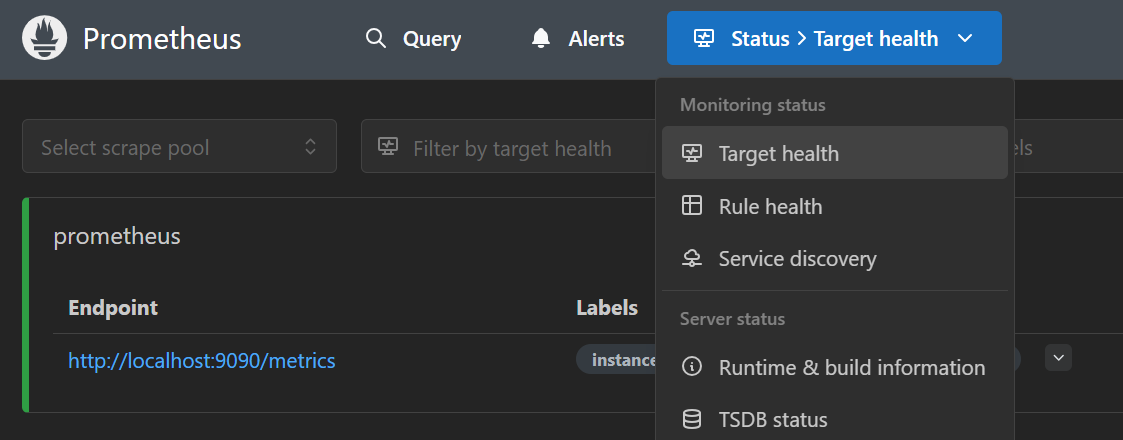
config에 작성한 수집 타겟도 정상적으로 표시되는 것을 확인했다.