What is a UML - state diagram (behavioral) give me an example
A state diagram, also known as a state machine diagram or statechart, is a type of behavioral diagram in UML that shows the sequence of states an object or system goes through during its lifetime in response to events.
Example2: A simple state diagram for a traffic light system that has three states: Red, Yellow, and Green. The state transitions occur in response to time or events such as pressing a pedestrian crossing button.
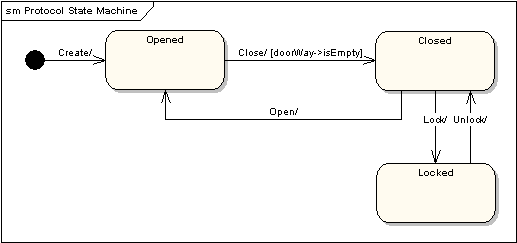
Example2: A door going through three states. Open -> closed -> locked.
States
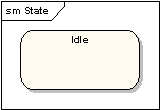
A state is denoted by a round-cornered rectangle with the name of the state written inside it.
Initial and Final States
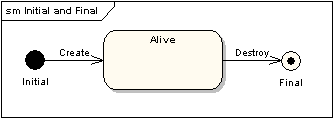
The initial state is denoted by a filled black circle and may be labeled with a name. The final state is denoted by a circle with a dot inside and may also be labeled with a name.
Transitions
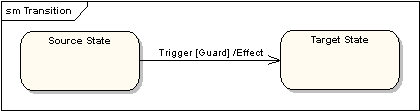
Transitions from one state to the next are denoted by lines with arrowheads. A transition may have a trigger, a guard and an effect, as below.
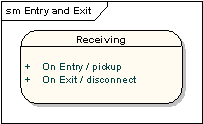
State Actions
In the transition example above, an effect was associated with the transition. If the target state had many transitions arriving at it, and each transition had the same effect associated with it, it would be better to associate the effect with the target state rather than the transitions. This can be done by defining an entry action for the state. The diagram below shows a state with an entry action and an exit action.
Reference
https://chat.openai.com/chat