Add Column Series & options
var series = chart.series.push(new am4charts.ColumnSeries());
// 디자인
series.columns.template.stroke = am4core.color("#ff0000"); // red outline
series.columns.template.fill = am4core.color("#00ff00"); // green fill
// 데이터 바인딩 (dataField 프로퍼티 세팅)
series.dataFields.categoryX = "country";
series.dataFields.valueY = "visits";
// 각 데이터 시리즈에 데이터 세팅
series1.data = [
  // Data set 1
];
series2.data = [
  // Data set 2
];
Font Size OF X FIELD
let categoryAxis = chart.xAxes.push(new am4charts.CategoryAxis());
categoryAxis.dataFields.category = "MONTHWEEK";
categoryAxis.title.text = "날짜";
categoryAxis.renderer.minGridDistance = 0; // 그리도 넓이
categoryAxis.renderer.grid.template.strokeOpacity = 0; // 그리드 제거
categoryAxis.renderer.labels.template.fontSize = 10; // 폰트 사이즈 조절!!!
Add ForceDirectedSeries & options
var chart = am4core.create(chartArea, am4plugins_forceDirected.ForceDirectedTree);
var networkSeries = chart.series.push(new am4plugins_forceDirected.ForceDirectedSeries())

networkSeries.data = [aJson]
		networkSeries.dataFields.name = "relTopic";
		networkSeries.dataFields.id = "relTopicId";
		networkSeries.dataFields.value = "relWeight";
		networkSeries.dataFields.children = "children";

		networkSeries.nodes.template.label.text = "{name}"
		networkSeries.fontSize = 10;
		networkSeries.minRadius = 20;
		networkSeries.maxRadius = 40;
		networkSeries.linkWithStrength = 0;
		networkSeries.nodes.template.events.on("hit", function(event) {
			if(event.target.dataItem._id){
				chatbot.extSend(event.target.dataItem.name.concat(" 정보 알려줘"), "T", event.target.dataItem._id)
			}

		});
var nodeTemplate = networkSeries.nodes.template;
		nodeTemplate.tooltipText = "{name}";
		nodeTemplate.fillOpacity = 1;
		nodeTemplate.label.hideOversized = true;
		nodeTemplate.label.truncate = true;
BulletPoint
var bullet = series1.bullets.push(new am4charts.CircleBullet());
bullet.circle.strokeWidth = 2;
bullet.circle.radius = 4;
bullet.circle.fill = am4core.color("#fff");

var bullethover = bullet.states.create("hover");
bullethover.properties.scale = 1.3;
Create Chart Instance
let chart = am4core.create("chartdiv", am4charts.PieChart);
var chart = am4core.create("chartdiv", am4charts.XYChart);
Chart Cursor
// Make a panning cursor
chart.cursor = new am4charts.XYCursor();
chart.cursor.behavior = "panXY";
chart.cursor.xAxis = dateAxis;
chart.cursor.snapToSeries = series;
Grid Change
categoryAxis.renderer.grid.template.strokeOpacity = 0; // 그리드 제거
//valueAxis.renderer.grid.template.stroke = am4core.color("#A0CA92");
//valueAxis.renderer.grid.template.strokeWidth = 2;
Mouse Cursor
// LineSeries
series.segments.template.interactionsEnabled = true;
series.segments.template.cursorOverStyle = am4core.MouseCursorStyle.pointer;
// ColumnSeries & PieSeries
series.slices.template.cursorOverStyle = am4core.MouseCursorStyle.pointer
series.columns.template.cursorOverStyle = am4core.MouseCursorStyle.pointer
// TO CATEGORY AXIS
categoryAxis.renderer.labels.template.cursorOverStyle = am4core.MouseCursorStyle.pointer;
Set Data
- 데이터는 기본적으로 JSON LIST 형태여야 한다.
- 네트워크 차트의 parent children의 경우 parent에 값이 있고 children에 하위 리스트를 담는다
예)
var aJson = new Object();
aJson.relTopic = list[0].topic;
aJson.relTopicId = list[0].topicId;

$.each(list, function(index, item) {
	item.relTopic = item.section;
});

aJson.children = list;

aJson.children.forEach(e => {
	e.children = e.topicList;
})

networkSeries.data = [aJson]
// 예 1)
chart.data = [{
"country": "Lithuania",
"litres": 501.9
}, {
"country": "Czech Republic",
"litres": 301.9
}, {
"country": "The Netherlands",
"litres": 50
}];
// 예 2)
[
{
"relTopicId": "T0000",
"topicId": "T0000",
"relWeight": "0.00949253",
"topicList": null,
"topic": null,
"section": "용어",
"relTopic": "인사"
},
{
"relTopicId": "T1111",
"topicId": "T1111",
"relWeight": "0.008439816",
"topicList": null,
"topic": null,
"section": "용어",
"relTopic": "사무"
},
]Set Legend
https://www.amcharts.com/docs/v4/concepts/legend/
chart.legend = new am4charts.Legend();
chart.legend.position = "center"; //right, left
Scrollbar
// Create vertical scrollbar and place it before the value axis
chart.scrollbarY = new am4core.Scrollbar();
chart.scrollbarY.parent = chart.leftAxesContainer;
chart.scrollbarY.toBack();

// Create a horizontal scrollbar with previe and place it underneath the date axis
chart.scrollbarX = new am4charts.XYChartScrollbar();
chart.scrollbarX.series.push(series);
chart.scrollbarX.parent = chart.bottomAxesContainer;
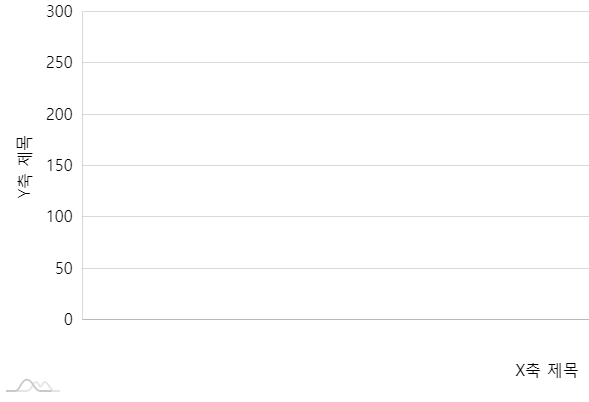
Title
let categoryAxis = chart.xAxes.push(new am4charts.CategoryAxis());
categoryAxis.title.text = "X축 제목";

let valueAxis = chart.yAxes.push(new am4charts.ValueAxis());
valueAxis.title.text = "Y축 제목";
XY Chart options
https://www.amcharts.com/docs/v4/chart-types/xy-chart/
// X 축
var categoryAxis = chart.xAxes.push(new am4charts.CategoryAxis());
// 옵션 추가
categoryAxis.dataFields.category = "country";
categoryAxis.renderer.grid.template.location = 0;
categoryAxis.renderer.minGridDistance = 60;
categoryAxis.tooltip.disabled = true;

// Y 축
var valueAxis = chart.yAxes.push(new am4charts.ValueAxis());
// 옵션 추가
valueAxis.renderer.minWidth = 50;
valueAxis.min = 0;
valueAxis.cursorTooltipEnabled = false;
XY Chart Width
let categoryAxis = chart.xAxes.push(new am4charts.CategoryAxis());
categoryAxis.dataFields.category = "country";
categoryAxis.title.text = "x 축 제목";
categoryAxis.renderer.minGridDistance =0; // 그리도 넓이
Have Custom Legend Icon
legend.data = [{
  "name": "가깝게",
  "flag": "/images/networkTopicIcon/ico_graph_sm.svg"
  //"fill": "black",
  //"isActive":false
}, {
  "name": "중간",
  "flag": "/images/networkTopicIcon/ico_graph_md.svg"
  //"fill": "black",
  //"isActive":true
}, {
  "name": "멀게",
  "flag": "/images/networkTopicIcon/ico_graph_lg.svg"
  //"fill": "black",
  //"isActive":false
}];

// SET CUSTOM LEGENDS =========
// 기본 아이콘 제거
var marker = legend.markers.template;
marker.disposeChildren();
marker.width = 30;
marker.height = 30;
// 이미지로 대체
let legendIcon = marker.createChild(am4core.Image);
legendIcon.width = 30;
legendIcon.height = 30;
legendIcon.verticalCenter = "top";
legendIcon.horizontalCenter = "left";

legendIcon.adapter.add("href", function(href, target) {
	console.log( '-------------');
	console.log(target.dataItem);
	//debugger;
  if (target.dataItem && target.dataItem.dataContext && target.dataItem.dataContext) {
	//debugger;
    return target.dataItem.dataContext.flag;
  }
  else {
    return href;
  }
});
// /SET CUSTOM LEGENDS =========
용어 정리
Series
-
유사하고 논리적으로 그룹핑된 데이터들의 모음 ( 개별적인 데이터를 묶어줌 )
-
차트에 있는 요소들의 특징과 표현에 영향을 줌.
-
collection of similar, logically grouped data points.
-
sets appearance and behavior of chart/map items
-
binds individual items to source data
출처
https://www.amcharts.com/demos-v4/#line-area
https://www.amcharts.com/docs/v4/
