Arthas 란
Alibaba 미들웨어 팀에서 개발한 Arthas는 Java 애플리케이션을 모니터링하고, 프로파일링 하고, 문제를 해결할 수 있는 진단 도구
언제 사용 해야할까?
Java 프로덕션 환경에서 문제가 발생 하였는데, 이를 디버깅 하거나 트러블 슈팅을 해야할 경우
제공되는 기능들
- Check whether a class is loaded? Or where the class is loaded from? (Useful for trouble-shooting jar file conflicts)
- Decompile a class to ensure the code is running as expected. (코드가 예상대로 실행되는지 클래스를 디컴파일 할 수 있음)
- Check classloader statistics, e.g. the number of classloaders, the number of classes loaded per classloader, the classloader hierarchy, possible classloader leaks, etc. (클래스 로더 통계를 확인 할 수 있음. 클래스 로더의 수, 클래스 로더당 로드된 클래스 수, 클래스 로더 계층 구조 등)
- Check the method invocation details, e.g. method parameter, returned values, exceptions and etc. (메소드 상세 정보 확인 할 수 있음, 매개변수, 반환 값, 예외 등)
- Check the stack trace of specified method invocation. This is useful when a developer wants to know the caller of the method. (지정된 메소드 호출의 스텍 추적을 확인할 수 있음. 이는 메소드 호출자를 알고 싶어 할 때 유용함)
- Trace the method invocation to find slow sub-invocations. (느린 하위 호출을 찾으려면 메소드 호출을 추적해야함)
- Monitor method invocation statistics, e.g. QPS (Query Per Second), RT (Return Time), success rate and etc. (QPS (초당 쿼리) , RT (반환 시간), 성공률 등 메소드 호출 통계를 모니터링함)
- Monitor system metrics, thread states and CPU usage, GC statistics and etc. (시스템 지표, 스레드 상태, CPU 사용율, GC 통계 등 모니터링)
- Supports command line interactive mode, with auto-complete feature enabled. (자동 완성 기능이 활성화된 명령어 대화형 모드 지원)
- Supports telnet and WebSocket, which enables both local and remote diagnostics with command line and browsers. (명령어와 브라우저로 로컬이나 원격진단이 가능하도록 텔넷과 웹소켓 지원)
- Supports profiler/Flame Graph (프로파일러와 프레임 그래프 지원)
- Support get objects in the heap that are instances of the specified class. (지정된 클래스의 인스턴스인 힙의 개체를 가져올 수 있도록 지원)
- Supports JDK 6+ (자바 6버전 이상 지원)
- Supports Linux/Mac/Windows (리눅스/Mac/Window 전부 지원)
설치 (linux)
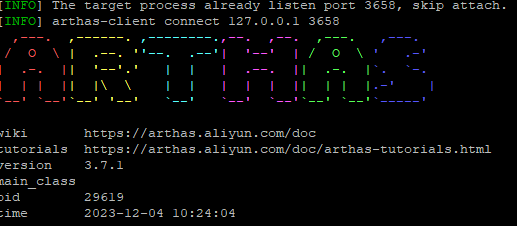
curl -O https://arthas.aliyun.com/arthas-boot.jar (다운로드)
$JAVA_17_HOME/bin/java -jar arthas-boot.jar (실행 / jdk 17버전을 사용하기 때문에 별도 classpath 지정)
기능
command
1. dashboard
2. getstatic
3. heapdump
4. jvm
5. logger
6. memory
7. ognl
8. perfcounter
9. sysenv
10. sysprop
11. thread
12. vmoption
13. vmtool
사용 후기
dashboard 명령어를 통해 메모리 사용을 어디서 많이 하는지, 해당 thread가 cpu를 얼마나 사용하는지 프로세스에 대한 상태를 점검 할 수 있었음.
또한, 어플리케이션에 대한 병목 확인도 thread 통계 정보를 통해 확인이 가능하며, heapdump 명령어를 사용하여, 해당 어플리케이션에 대한 트러블 슈팅이 가능함.
arthas 메인 Docs : https://arthas.aliyun.com/en/doc/

어제보다 오늘이 더 나은 개발자