[Seminar] Code quality improvement(1) Introduction of Centralized Log Management(CLM), Kibana (WIP) (last update: 21.12.31.)
Weekly Seminar
0. Reference
What is Kibana
https://www.elastic.co/what-is/kibana
What is Centralized Log Management (CLM)?
https://www.missioncloud.com/blog/what-is-centralized-log-management-clm
1. Introduction
Code quality Improvement, 즉 코드 품질 개선을 위한 Centralized Logs Management(CLM)에 대해서 알아보고, 이의 시각적인 이해도를 돕는 툴인 Kibana에 대해 알아본다.
2. Explanation
2-1. Centralized Log Management(CLM)
Almost every application that runs in a server environment generates logs automatically. These logs are a vital part of any system because they provide essential information about how a system is presently operating and also, how it operated in the past. By searching through log data, you're able to pinpoint issues, errors, and trends.
However, it can be extremely time consuming and frustrating to manually look up one particular error on hundreds, or even thousands of servers, across thousands of log files.
서버 환경에서 실행되는 거의 모든 어플리케이션들은 자동으로 로그를 생성한다. 이 로그들은 시스템이 현재 어떻게 운영되고 있는지, 또한 어떻게 운영되었었는지에 대한 핵심적인 정보들을 제공하기 때문에 그 어떤 시스템에서도 필수불가결하다. 로그 데이터를 검색한다는 것은 이슈들, 에러, 트렌드에 정확하게 접근하는 것이 가능해진다는 것을 의미한다.
하지만, 수없이 많은 로그 파일들을 넘어 마찬가지로 셀 수 없는 서버들에서 하나의 에러를 직접 찾아내기란 무지막지한 시간을 쏟아야 하고, 매우 절망스러울 것이다.
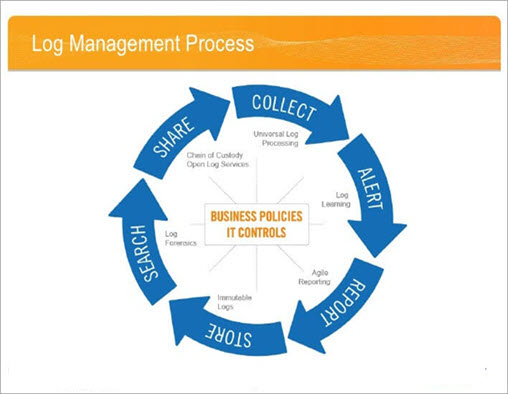
Centralized Log Management(CLM) is a type of logging solution system that consolidates all of your log data and pushes it to one central, accessible, and easy-to-use interface. Centralized logging is designed to make your life easier. Not only does CLM provide multiple features that allow you to easily collect log information, but it also helps you consolidate, analyze, and view that information quickly and clearly. CLM gives you tons of capabilities including :
중앙화된 로그 관리(CLM)은 모든 로그 데이터를 하나의 중앙에 통합하고, 접근 가능한, 그리고 사용이 편리한 인터페이스인 로깅 솔루션의 일종이다. 중앙화된 로깅은 삶을 보다 쉽게 만들어주도록 설계되었다. CLM은 로그 정보들을 쉽게 모아주는 다양한 기능들을 제공하지는 않지만 통합, 분석, 그리고 정보들을 빠르고 명확하게 정보들을 볼 수 있도록 돕는다. CLM은 다음과 같은 수많은 역량의 제공을 포함하고 있다:
* Storing log data from multiple sources in a central location
* Enforcing retention policies on your logs so they are available for a specific time period
* Easily searching inside the logs for important information
* Generating alerts based on metrics you defined on the logs
* Sharing you dashboard and log information with others simply and quickly
* Low costs and increased storage and backup for historical data
* Setting up security alerts and granting login access to particular users without granting server root access
- 복수의 소스들로부터 하나의 중앙 장소에 로그 데이터를 저장한다
- 로그에 정체 정책을 강제하여 특정 시간대에 (접근이) 가능하다
- 로그 내 중요 정보에 대한 검색이 용이하다
- 로그에 정의한 매트릭스를 기반으로 경보를 생성한다
- 대쉬보드와 로그 정보들을 다른 이들과 쉽고 빠르게 공유한다
- 저비용이며, 역대 데이터를 백업하고 스토리지를 증가시킨다
- 서버 root 접근 권한을 부여하지 않아도 부분적인 사용자들에게 로그인 권한을 부여하며 보안 경보를 설정한다
CLM allows you to do more with your log data and manage it much more efficiently. You'll have the ability to access the data you want in seconds rather than hours, weeks, or even days by manually searching through tons of logs. Taking advantage of centrally dynamic, profitable, and secure.
중앙화된 로그 관리는 로그 데이터들과 함께 더 많은 작업을 해내도록 하며 이는 보다 효율적이다. 당신은 몇 시간, 주 또는 많은 날들을 직접 수많은 로그들을 검색하는 대신 데이터에 몇 초 안에 접근할 수 있는 능력을 갖게 될 것이다. 중앙-동적인, 이득이 되는, 그리고 보안적인 이점을 갖는 것이다.
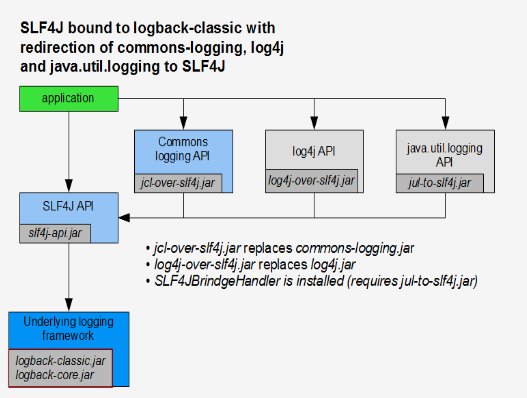
ELK Stack is an open-source centralized logging solution based on Elasticsearch for collecting, parsing, and sotring logs. Elasticsearch, Logstash, and Kibana, when used together, form an end-to-end stack (ELK Stack) and real-time data analytics tool that provides actionable insights from almost any type of structured and unstructured data source.
ELK(ElasticSearch, Logstash, Kibana) 스택은 수집, 파싱, 그리고 로그 분류를 위한 ElasticSearch에 기반한 오픈소스 중앙화된 로깅 솔루션이다. Elasticsearch, Logstash, 그리고 Kibana는 함께 사용할 때 하나의 끝판왕 스택이며 거의 모든 유형의 정형 및 비정형 데이터소스의 실행 가능한 통찰로써의 실시간 데이터 분석 툴 양식이다.
2-2. Kibana, Elastic Search
Kibana is a free and open user interface that lets you visulaize your Elasticsearch data and navigate the Elastic Search.
Kibana는 당신의 Elasticsearch 데이터를 시각화하고 다룰 수 있도록 하는 무료 오픈소스 인터페이스이다.
It's an free and open frontend application that sits on top of the Elastic stack, providing search and data visualization capabilities for data indexed in Elastic search. Commonly known as the charting tool for the Elastic stack (Previously referred to as the ELK stack after Elasticsearch, Logstash and Kirbana.) Kirbana also acts as the user interface for monitoring, managing, and securing an Elastic Cluster - as well as the centralized hub for built-in solutions developed on the Elastic stack.
이는 Elastic 스택의 최상위에 위치한, Elasticsearch에서 인덱스된 데이터를 위한 검색 제공 및 데이터 시각화 역량을 제공하는 무료 오픈 프론트엔드 어플리케이션이다. 일반적으로 알려진 Elastic stack의 차트 생성 도구 (Elasticsearch, Logstash, Kibana)
3. Remark