서론
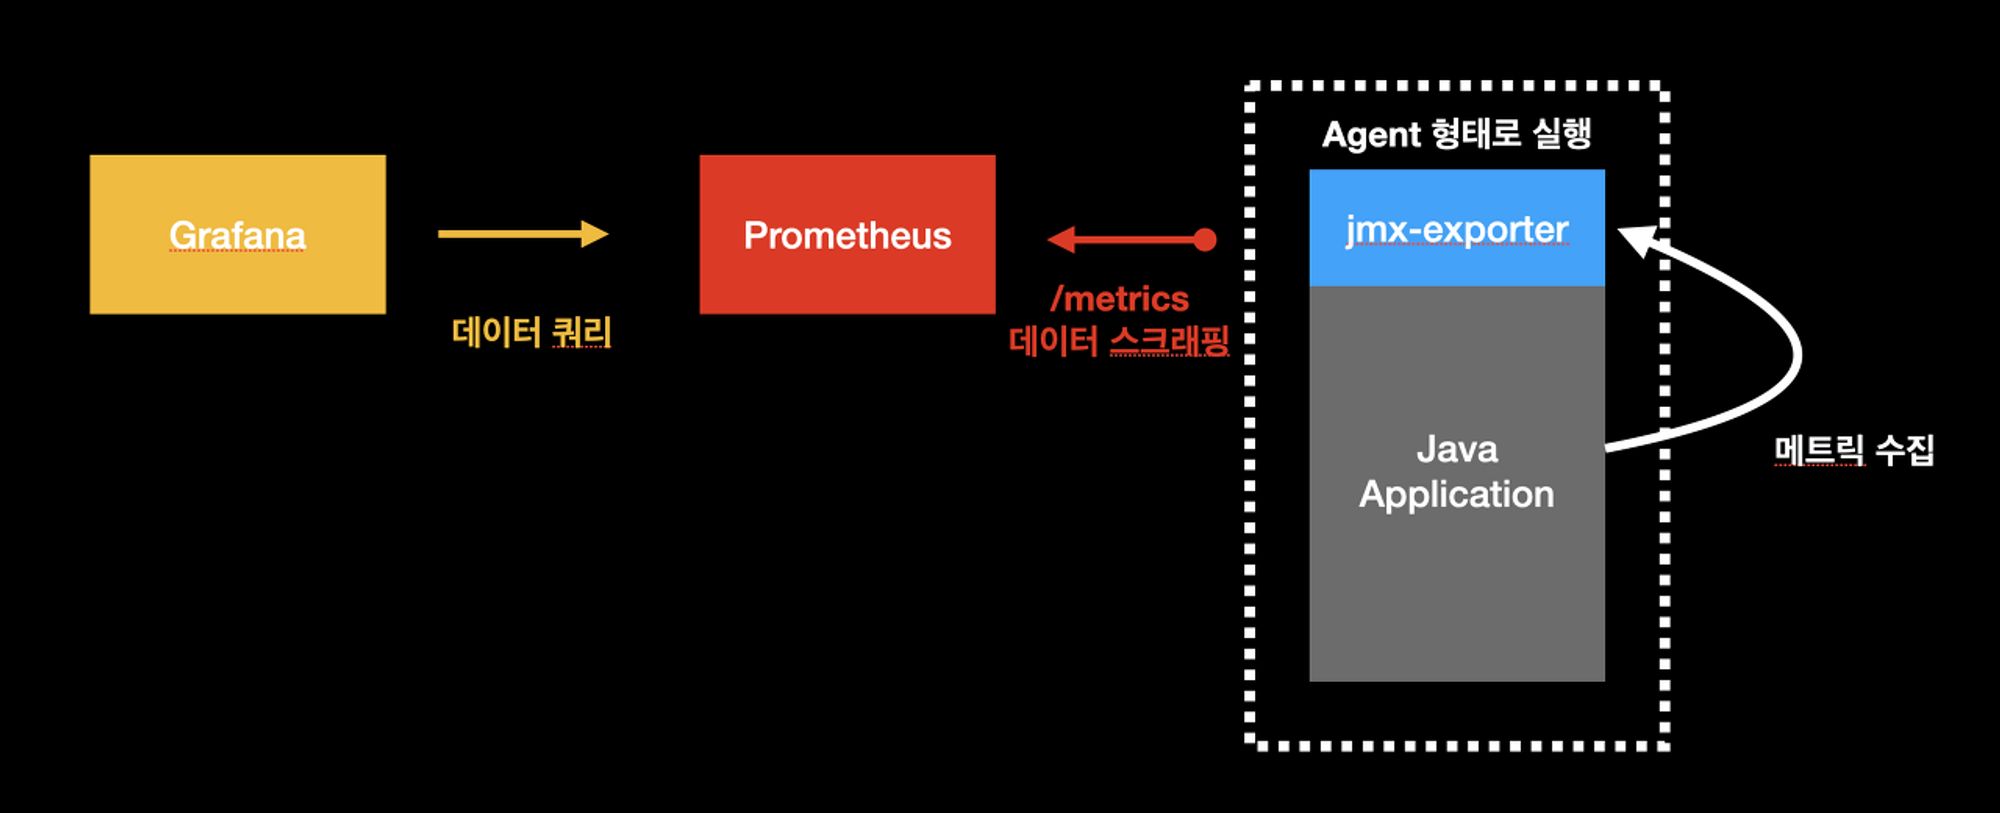
Google Cloud 관리형 쿠버네티스에서 오픈 소스 Prometheus + grafana를 통해 JVM 기반의 어플리케이션을 모니터링 환경 구성 및 대시보드 구성 방법에 대한 정리
목표 플로우와 작업의 진행 순서만 간략하게 정리하였습니다.
혹시 더 자세한 설명이 필요시 블로그를 참고해주세요
참조 블로그 https://gurumee92.tistory.com/277
진행 순서
- jmx agent, config yaml configmap으로 등록
- tomcat 이미지에 볼륨 마운트로 연결
- Prometheus config 설정을 통해 jmx-exporter 데이터 스크래핑
- Grafana로 Prometheus 데이터 쿼리로 가져와 모니터링
기본 환경
GKE Cluster가 배포되어 있는상태
Google CLI를 통해 Cluster와 연결 후 다음 작업 진행
GKE에 JMX export 설치하기
infrastructure
사용 방식
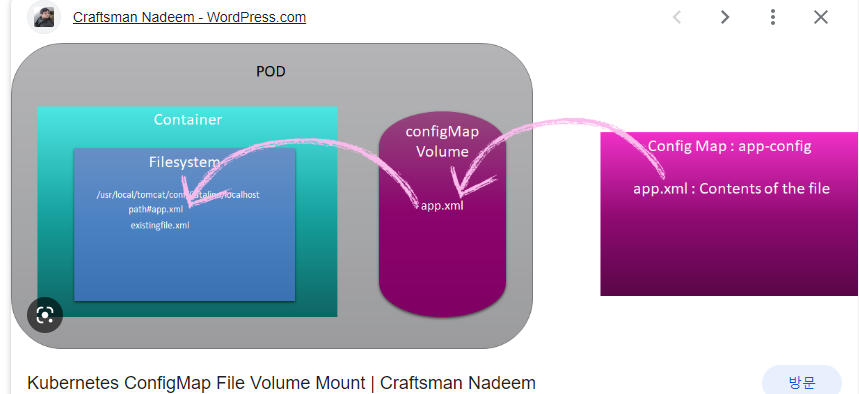
wget을 통해 가져온 jmx-export를 Config Map에 저장하고 사용중인 Container내의 volume mount 시켜주는 방식 이용
1. JMX agent
configmap 배포
jmx-export-config : 가져오는 메트릭을 지정하는 설정값 config.yaml로 생성
apiVersion: v1
kind: ConfigMap
metadata:
  name: jmx-export-config
data:
  config.yaml: |-
    lowercaseOutputLabelNames: true
    lowercaseOutputName: true
    rules:
      - pattern: 'Catalina<type=GlobalRequestProcessor, name=\"(\w+-\w+)-(\d+)\"><>(\w+):'
        name: tomcat_$3_total
        labels:
          port: "$2"
          protocol: "$1"
        help: Tomcat global $3
        type: COUNTER
      - pattern: 'Catalina<j2eeType=Servlet, WebModule=//([-a-zA-Z0-9+&@#/%?=~_|!:.,;]*[-a-zA-Z0-9+&@#/%=~_|]), name=([-a-zA-Z0-9+/$%~_-|!.]*), J2EEApplication=none, J2EEServer=none><>(requestCount|maxTime|processingTime|errorCount):'
        name: tomcat_servlet_$3_total
        labels:
          module: "$1"
          servlet: "$2"
        help: Tomcat servlet $3 total
        type: COUNTER
      - pattern: 'Catalina<type=ThreadPool, name="(\w+-\w+)-(\d+)"><>(currentThreadCount|currentThreadsBusy|keepAliveCount|pollerThreadCount|connectionCount):'
        name: tomcat_threadpool_$3
        labels:
          port: "$2"
          protocol: "$1"
        help: Tomcat threadpool $3
        type: GAUGE
      - pattern: 'Catalina<type=Manager, host=([-a-zA-Z0-9+&@#/%?=~_|!:.,;]*[-a-zA-Z0-9+&@#/%=~_|]), context=([-a-zA-Z0-9+/$%~_-|!.]*)><>(processingTime|sessionCounter|rejectedSessions|expiredSessions):'
        name: tomcat_session_$3_total
        labels:
          context: "$2"
          host: "$1"
        help: Tomcat session $3 total
        type: COUNTER
jmx-javaagent configmap으로 생성
wget https://repo1.maven.org/maven2/io/prometheus/jmx/jmx_prometheus_javaagent/0.18.0/jmx_prometheus_javaagent-0.18.0.jar
kubectl create configmap jmx-prometheus-javaagent --from-file=jmx_prometheus_javaagent-0.18.0.jar
2. Tomcat 컨테이너에 Volume mount
tomcat.yaml : tomcat 이미지와 jmx-exporter 메트릭은 8081로 받게끔
apiVersion: apps/v1
kind: Deployment
metadata:
  name: tomcat
spec:
  replicas: 1
  selector:
    matchLabels:
      app: tomcat
  template:
    metadata:
      labels:
        app: tomcat
    spec:
      volumes:
      - name: config-volume
        configMap:
          name: jmx-prometheus-javaagent

      - name: jmx-export-config
        configMap:
          name: jmx-export-config
          items:
          - key: config.yaml
            path: config.yaml
    # 기존 컨테이너 이미지 사용
      containers:
      - name: tomcat
        image: tomcat:latest
        ports:
        - containerPort: 8080

    # Configmaps Volume을 저장 할 곳 지정
        volumeMounts:
        - name: jmx-export-config
          mountPath: /opt/jmx_exporter/export-config/
        - name: config-volume
          mountPath: /opt/jmx_exporter/
        env:
        - name: CATALINA_OPTS
    # jmx 메트릭을 보내줄 포트 지정
          value: "-javaagent:/opt/jmx_exporter/jmx_prometheus_javaagent-0.18.0.jar=8081:/opt/jmx_exporter/export-config/config.yaml"
metric이 정상적으로 출력 되는지 확인
kubectl exec <tomcat-pod-name> -- curl http://localhost:8081/metrics
서비스 노출
kubectl expose deployment tomcat --name=tomcat-jvm-service --type=LoadBalancer
3. Prometheus config 설정을 통해 jmx-exporter 데이터 스크래핑
configmap 배포
prom-config.yaml
apiVersion: v1
kind: ConfigMap
metadata:
  name: prometheus-config
data:
  prometheus.yml: |
    global:
      scrape_interval: 1m
    scrape_configs:
      - job_name: 'jmx-exporter'
        metrics_path: '/metrics'
        static_configs:
 ## Tomcat Endpoint로 연결 필요
          - targets: ['<tomcat-pod-IP>']
kubectl get pod -o wide 확인
deployment 배포
prometheus.yaml
apiVersion: apps/v1
kind: Deployment
metadata:
 name: prometheus
spec:
 replicas: 1
 selector:
   matchLabels:
     app: prometheus
 template:
   metadata:
     labels:
       app: prometheus
   spec:
     containers:
       - name: prometheus
         image: prom/prometheus:v2.32.1
         args:
           - "--config.file=/etc/prometheus/prometheus.yml"
           - "--storage.tsdb.path=/prometheus"
         ports:
           - name: web
             containerPort: 9090
         volumeMounts:
           - name: prometheus-config
             mountPath: /etc/prometheus
             readOnly: true
           - name: prometheus-storage
             mountPath: /prometheus
     volumes:
       - name: prometheus-config
         configMap:
           name: prometheus-config
       - name: prometheus-storage
         emptyDir: {}
서비스 노출
kubectl expose deployment prometheus --name=prometheus-service --type=LoadBalancer
Targets으로 들어가 연결 확인
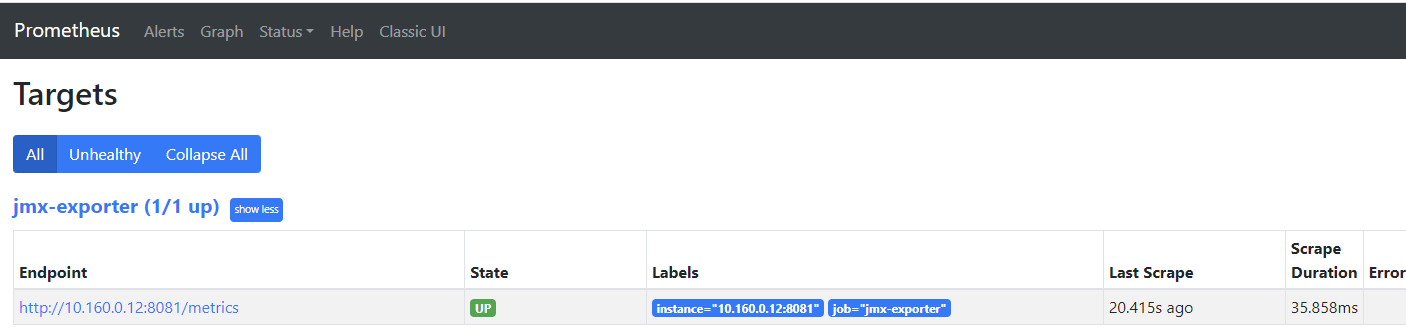
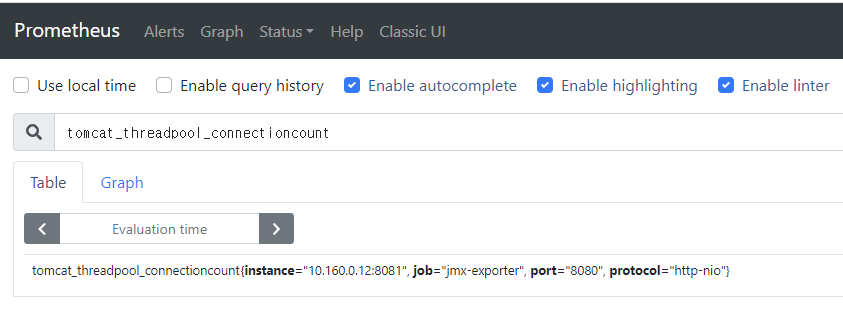
연결이 잘되었으면 쿼리 입력시 인스턴스가 잘 나오는것을 확인 할 수 있음.
4. Grafana로 Prometheus 데이터 쿼리로 가져와 모니터링
grafana.yaml
apiVersion: apps/v1
kind: Deployment
metadata:
 creationTimestamp: null
 labels:
   app: grafana
 name: grafana
spec:
 replicas: 1
 selector:
   matchLabels:
     app: grafana
 strategy: {}
 template:
   metadata:
     creationTimestamp: null
     labels:
       app: grafana
   spec:
     containers:
     - image: grafana/grafana-enterprise
       name: grafana-enterprise
       ports:
       - containerPort: 3000
       resources: {}
status: {}
서비스 노출
kubectl expose deployment grafana --name=grafana-service --type=LoadBalancer
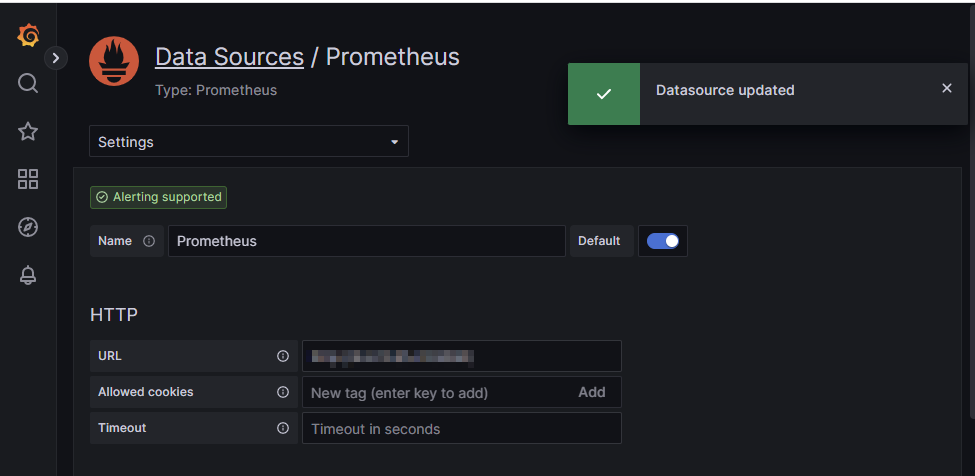
데이터소스로 프로메테우스로 가져오기
대시보드 가져오기
jvm 모니터링에 가장 다운로드 수가 많은 7727 대시보드 import
결과
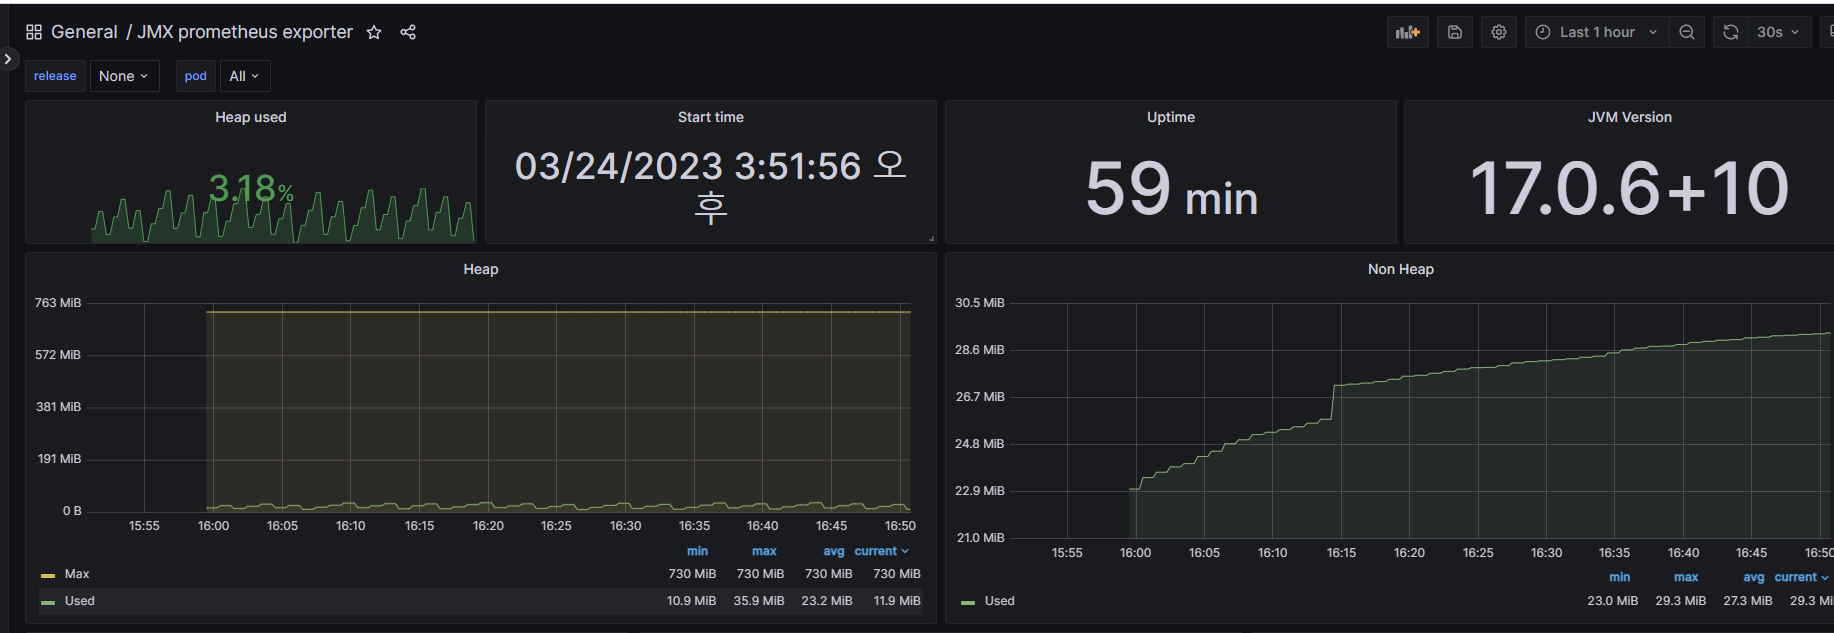
이렇게 Heap memory 사용량 확인과 함께 JVM Monitoring 구성이 가능합니다.