단계 2) Prometheus를 이용하여 metric 수집
0
Prometheus를 이용하여 metric 수집
Prometheus를 다운로드한 폴더에서prometheus.yml파일을 다음과 같이 수정한다.
prometheus.yml
...
(생략)
    static_configs:
- targets: ["localhost:7890"](targets에 jmx-exporter에서 metric을 추출한 "host:port"를 입력)
- 파일을 저장한 뒤 같은 경로에 있는
prometheus.exe를 실행하여 서버를 구동한다. - 서버를 구동한 후
http://localhost:9090으로 접속 후metric을 수집하고 있는 대상 시스템 목록을 확인한다.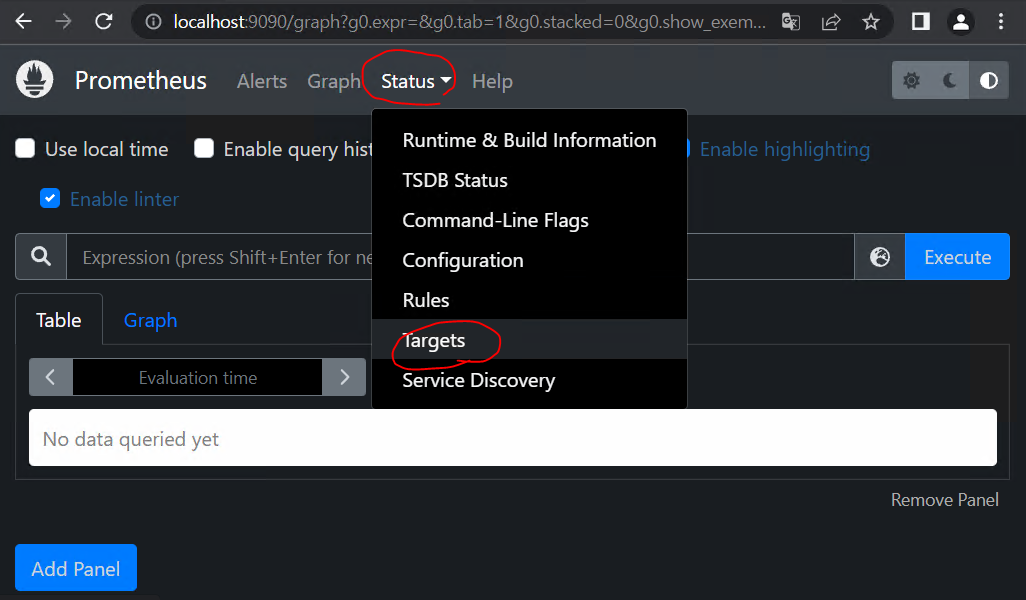
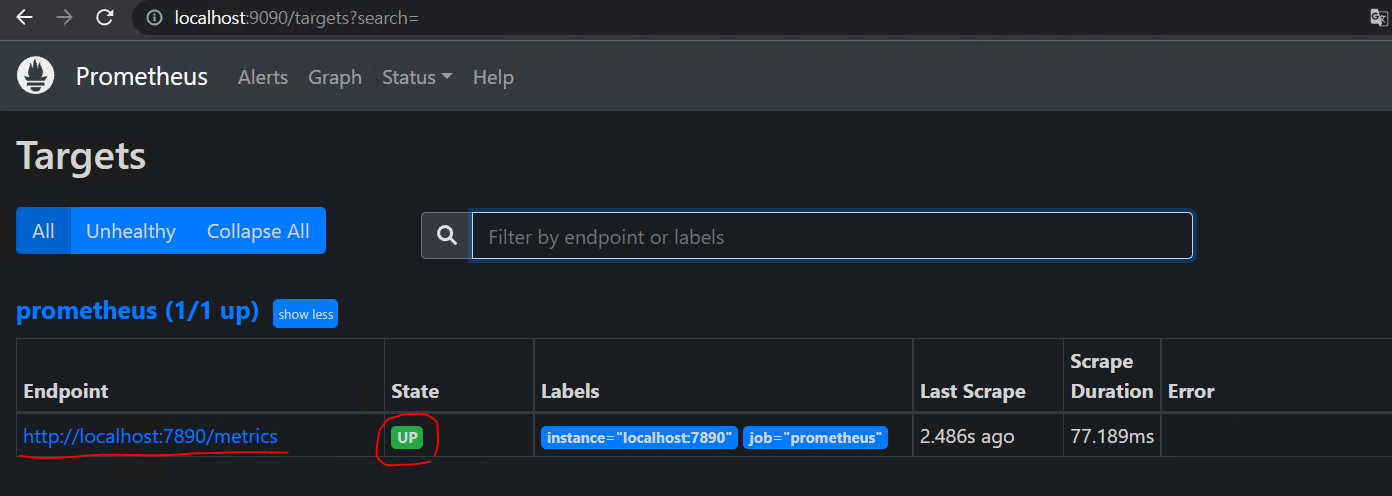
prometheus.yml에서 등록한metric을 수집하고있는 대상 시스템의endpoint들을 확인할 수 있으며state가up인 경우에 정상적으로 수집하고 있는 것 이다.
이제 다음장에서 Grafana를 활용해서 metric을 시각화 해보자.

안녕하세요