1.Requirements
- Need to monitor specific network traffic without using APM or log monitoring tools
- Prefer a solution that requires minimal implementation effort and introduces low system overhead
2. Solution : Kernel-level TCP event tracing using eBPF-based BCC
1) What’s BCC?
BCC (BPF Compiler Collection) uses eBPF technology to write tracing programs that run inside the Linux kernel, enabling efficient and low-overhead monitoring of system events.
GitHub - iovisor/bcc: BCC - Tools for BPF-based Linux IO analysis, networking, monitoring, and more
2) How BCC works?
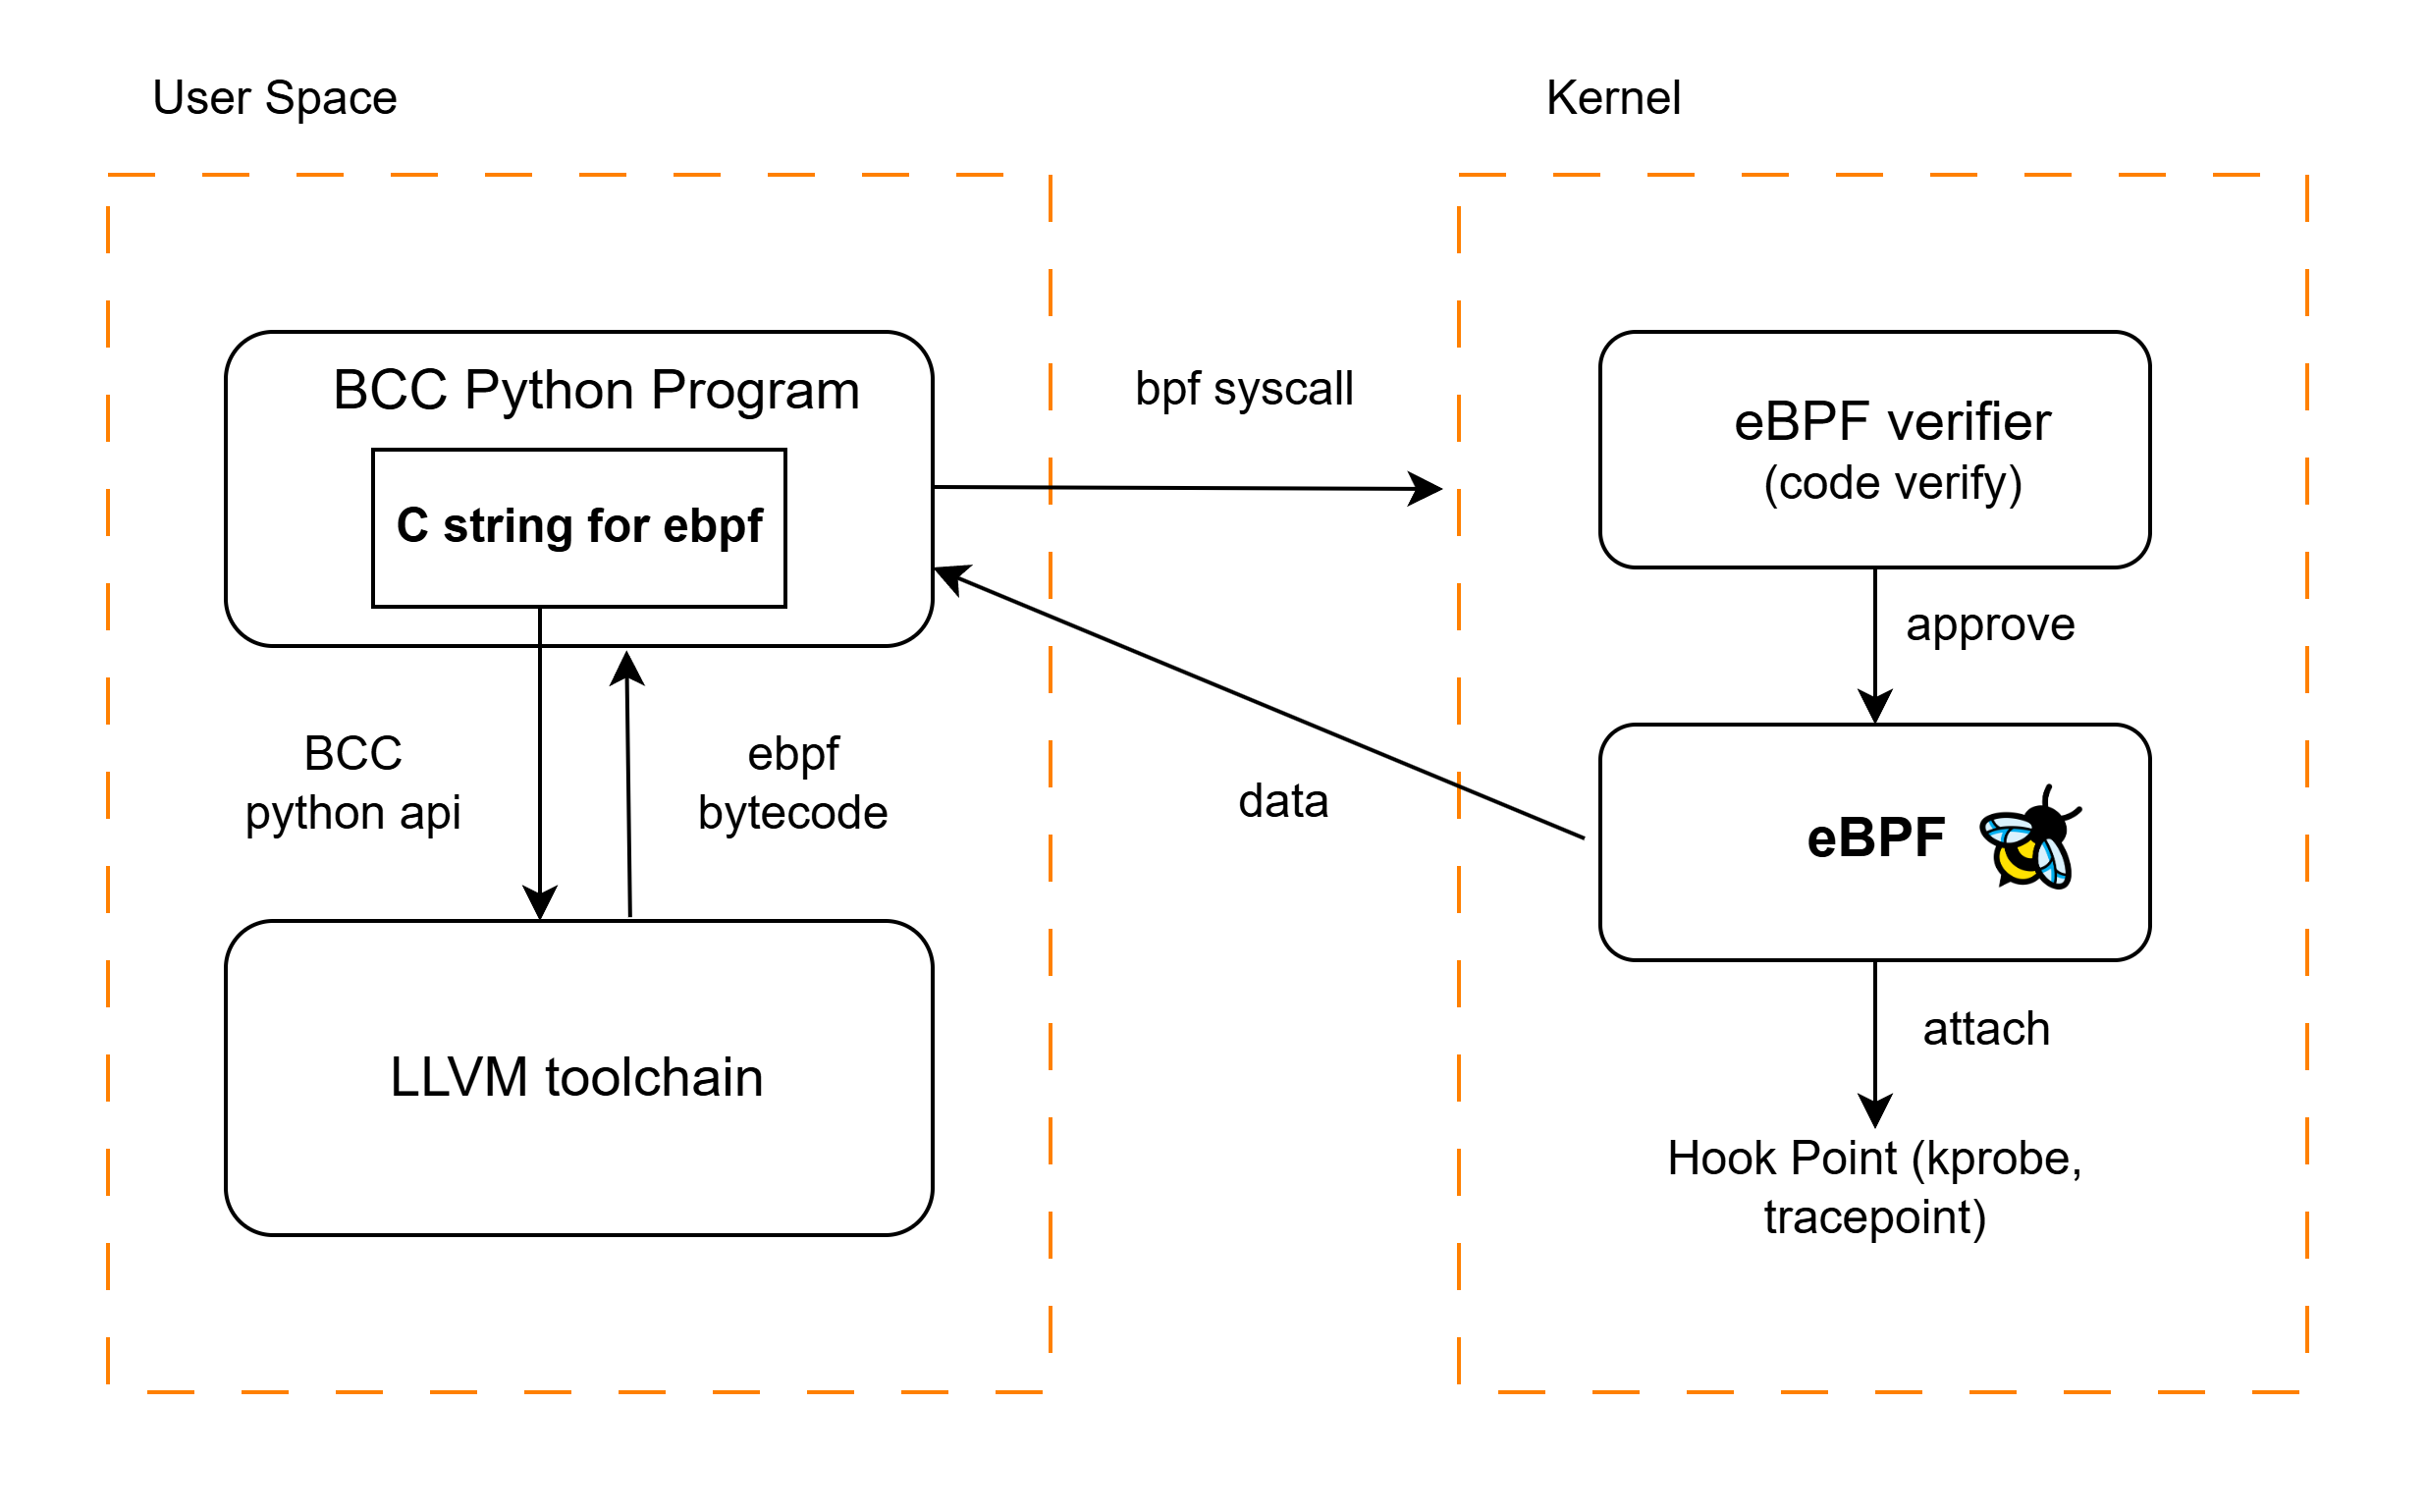
- The BCC Python program defines eBPF C code as a string
- This code is compiled into eBPF bytecode using LLVM
- The bytecode is loaded into the kernel and verified by the kernel verifier
- After Validation eBPF program is attached to kernel hooks like kprobes or tracepoints.
- When the hooked kernel event occurs, the eBPF program runs and sends collected data to user space.
- The BCC Python program receives and processes or displays the data.
3. Build Simple NetworkMonitoring with BCC
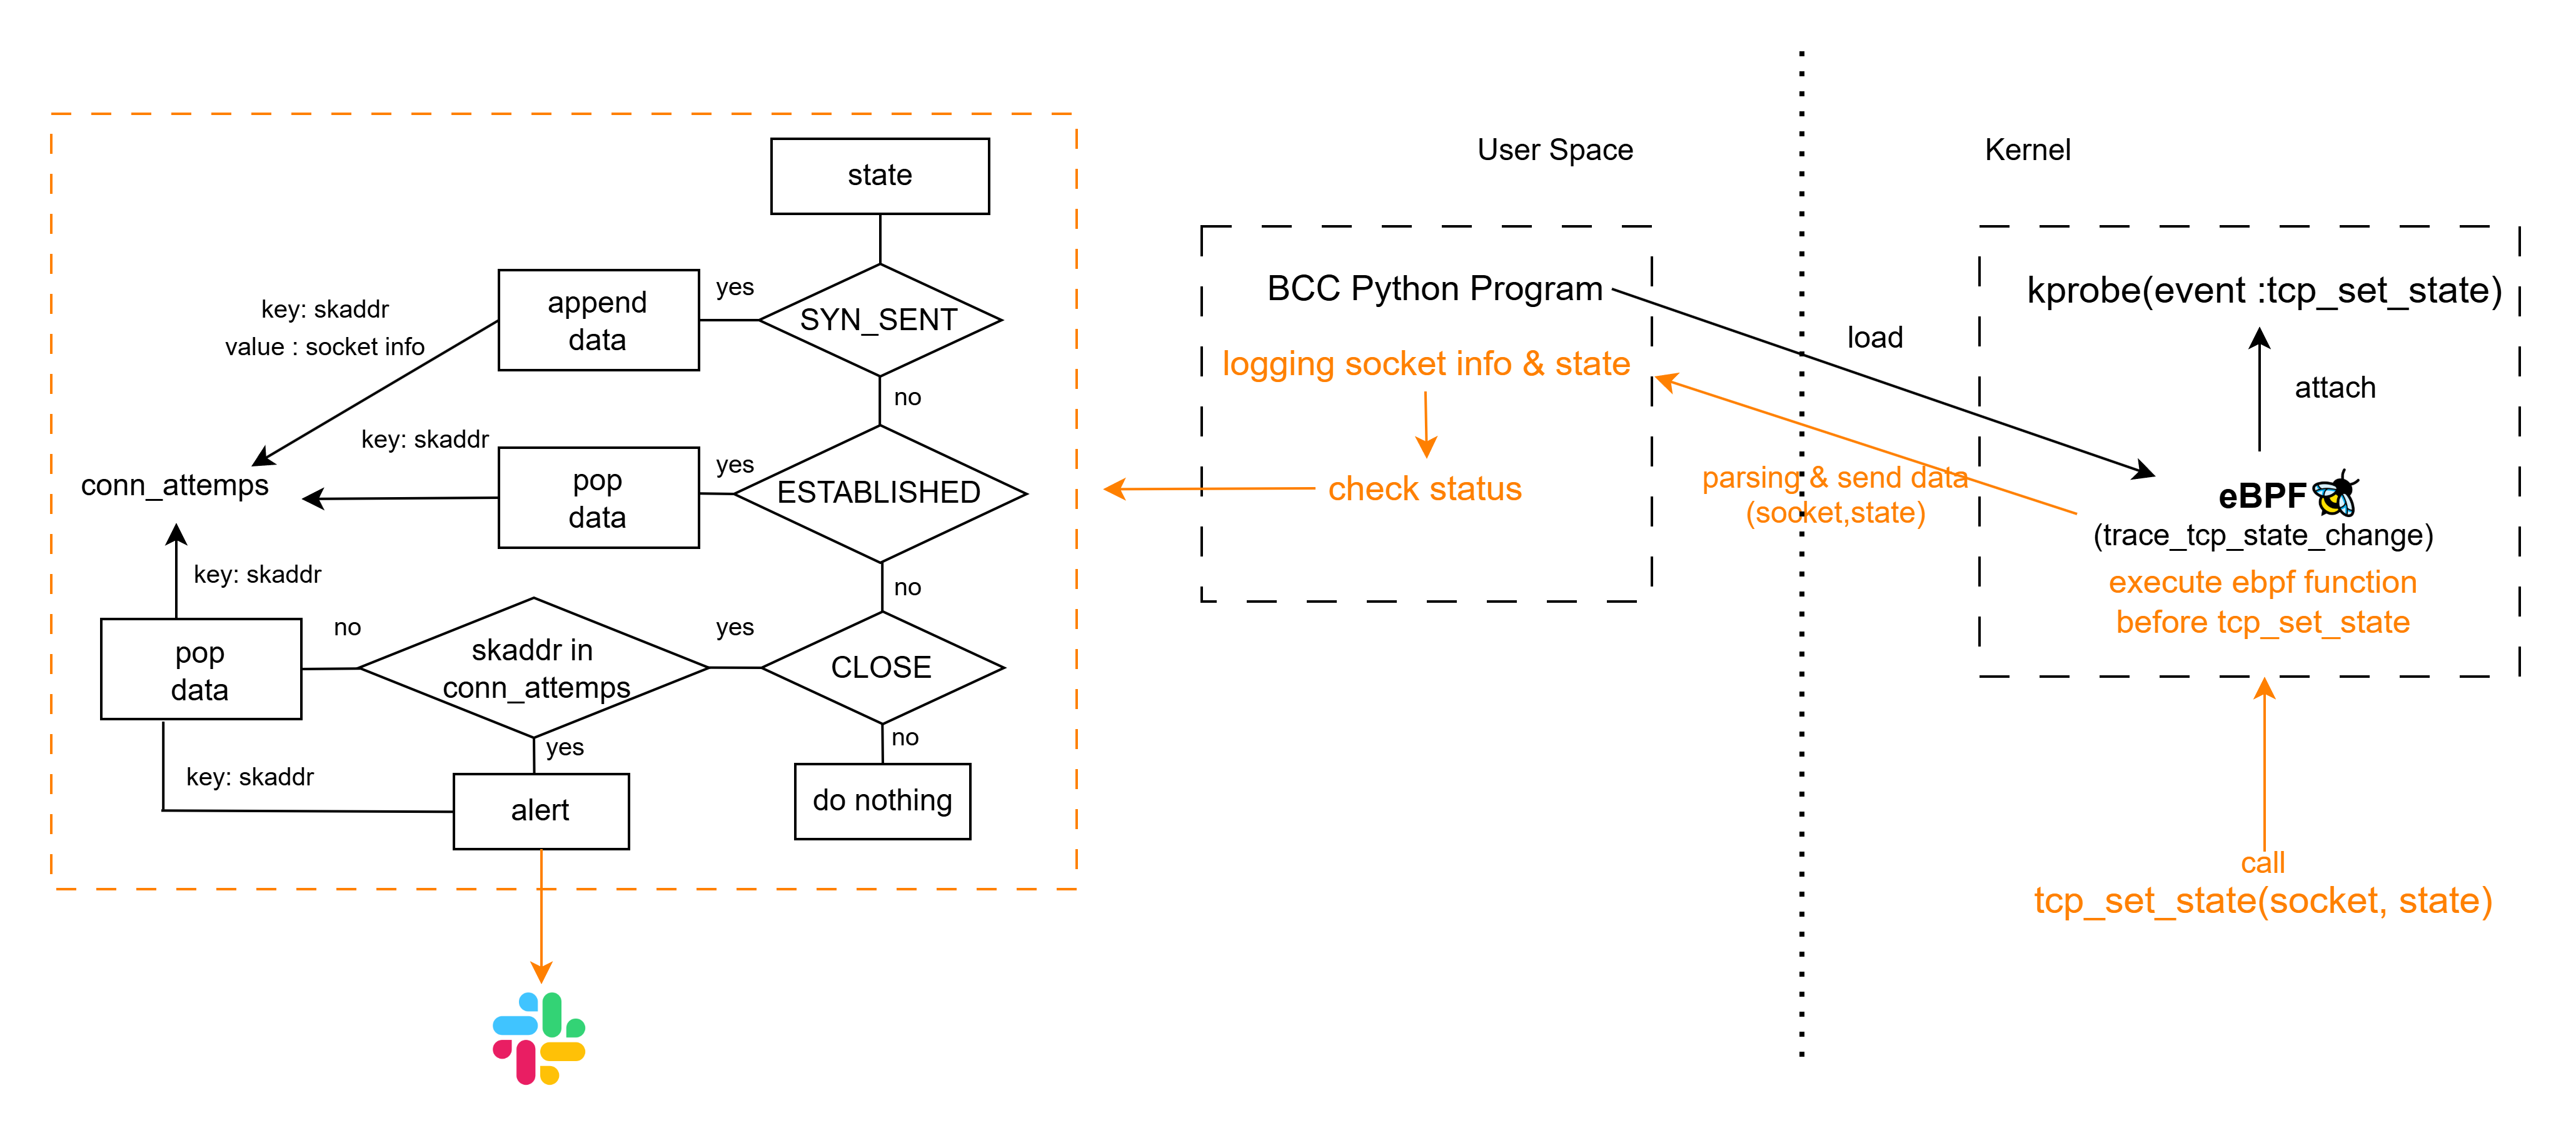
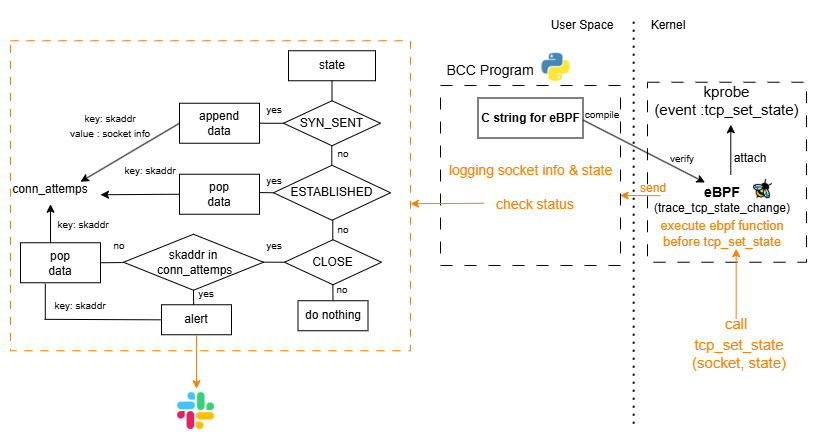
1) Logic
- When the tcp_set_state kernel function is called, an eBPF function is triggered before entry kernel function (kprobe)
- The eBPF program get socket state information from tcp_set_state call
and sends it to user space through a buffer
(socket address, source address/port, destination address/port, state). - In user space, a Python program continuously polls the buffer
- Based on the TCP state from buffer, Python program processes as follows:
- SYN_SENT: Records a connection attempt (keyed by socket address)
- ESTABLISHED: Marks a successful connection → removes the record (keyed by socket address)
- CLOSE: Determines whether the connection was successful or failed:
- If a record still exists → connection was never successful → considered a failure → send Slack alert
- If the record is missing → connection had previously succeeded → considered a normal close
The socket address is unique to each socket because it is an address value.
2) Code
Full Code URL
BPF Function (c string)
- Extracts the sock structure and state argument from tcp_set_state and sends them to user space.
- Tracing is limited to a specific destination IP address to reduce overhead.
int trace_tcp_state_change(struct pt_regs *ctx, struct sock *sk, int state) {
    u16 family = sk->__sk_common.skc_family;
    if (family != AF_INET)
        return 0;

    u32 daddr = sk->__sk_common.skc_daddr;
    if (daddr != DEST_IP)
        return 0;

    struct event_t ev = {};
    ev.skaddr = (u64)sk;
    ev.pid = bpf_get_current_pid_tgid() >> 32;
    ev.state = state;

    bpf_probe_read_kernel(&ev.saddr, sizeof(ev.saddr), &sk->__sk_common.skc_rcv_saddr);
    bpf_probe_read_kernel(&ev.daddr, sizeof(ev.daddr), &sk->__sk_common.skc_daddr);
    bpf_probe_read_kernel(&ev.sport, sizeof(ev.sport), &sk->__sk_common.skc_num);
    bpf_probe_read_kernel(&ev.dport, sizeof(ev.dport), &sk->__sk_common.skc_dport);

    ev.dport = ntohs(ev.dport);

    events.perf_submit(ctx, &ev, sizeof(ev));
    return 0;
}
Logging & Check Status & Alert Message
- Store the data received from eBPF into a struct(event)
- Log data
- Add or remove entries from the conn_attempts map based on TCP state
- If a connection is deemed to have failed, send an alert message(slack)
def print_event(cpu, data, size):
event = ctypes.cast(data, ctypes.POINTER(Event)).contents
state_name = TCP_STATES.get(event.state, f"UNKNOWN({event.state})")
logger.info("%-6d %-15s %-15s %-15s %-6d %-6d" % (
event.pid,
state_name,
inet_ntoa(event.saddr),
inet_ntoa(event.daddr),
event.sport,
event.dport
))
if state_name == "SYN_SENT":
conn_attempts[event.skaddr] = event
elif state_name == "ESTABLISHED":
conn_attempts.pop(event.skaddr, None)
elif state_name == "CLOSE":
if event.skaddr in conn_attempts:
dest_ip=inet_ntoa(event.daddr)
dest_port=event.dport
logger.warning(f"TCP failure detected: {dest_ip}:{dest_port}")
alert_message_slack(f"TCP failure detected: {dest_ip}:{dest_port}")
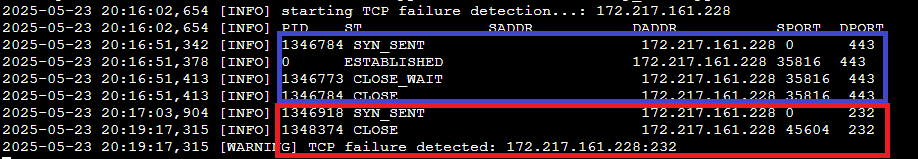
conn_attempts.pop(event.skaddr, None)3) Result
- test with google ipaddress (172.217.161.228)
- Correct Port Usage(443) → Connection reaches ESTABLISHED state → Close state
- Normal Communication
- InCorrect Port Usage(232) → Connection goes Close state without ESTABLISHED
- Communication failure → Trigger alert

4. Operating Simple Network Monitoring
1) Operating with Systemd
- example /eyc/systemd/system/tcp_trace.service
[Unit]
Description=TCP Trace BPF Monitor
After=network.target

[Service]
ExecStart=/usr/bin/python3 /usr/local/bin/tcp_trace.py --log-file /var/log/tcp_trace.log
Restart=on-failure
User=root
Environment=DEST_IP=172.217.161.228
Environment=SLACK_URL=https://hooks.slack.com/services
StandardOutput=null
StandardError=null

[Install]
WantedBy=multi-user.target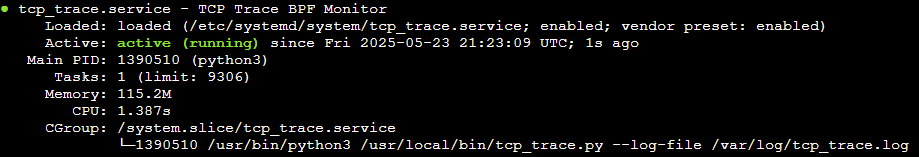
In actual operation, logrotate is also necessary.
2) Monitoring Overhead with Real Traffic Processing
- Case 1: Traffic Test X, BCC X
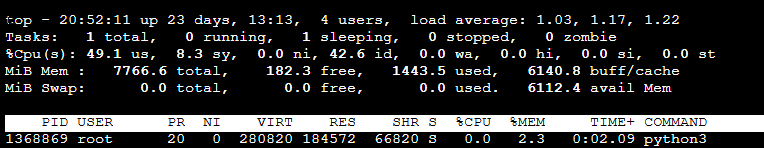
- Case 2: Traffic Test X, BCC O (slack alert off)
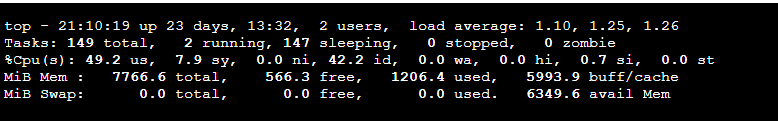
- Case 3: Traffic Test O, BCCX
- ab -n 50000 -c 100 http://172.217.161.228:80
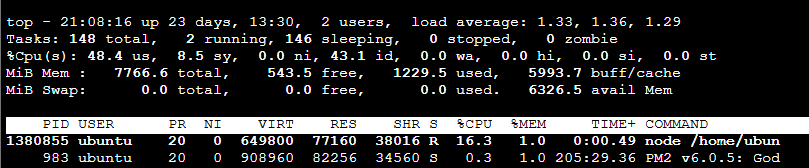
- Case 4: Traffic Test O, BCC O (slack alert off)
- ab -n 50000 -c 100 http://172.217.161.228:80
- Result
- Registering eBPF functions in the kernel by BCC shows no significant difference in kernel time, which can be considered negligible
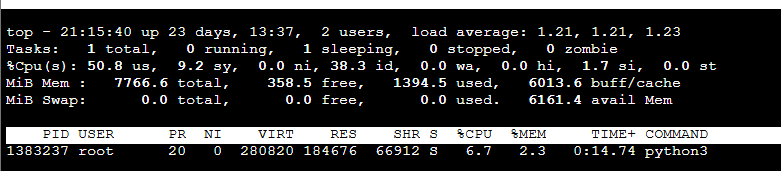
- Running the BCC application and sending 50,000 requests (with 100 concurrent connections) results in no increase in memory usage and a maximum CPU usage of 7% (based on an m7g.large instance with 2 vCPUs and 8 GB RAM)
- Considering that the user space application was developed without extensive performance optimization, this is an excellent result
This test was not a rigorous load test, so it is difficult to confidently assert that the monitoring system can operate under typical production loads without any issues.
However, it clearly confirms that eBPF-based monitoring incurs minimal overhead as theoretically expected.
5. Conclusion
By utilizing BCC (BPF Compiler Collection) to trace kernel-level TCP events based on eBPF, the following characteristics were directly observed:
- TCP communication states can be efficiently monitored without the need for APM tools or log collection systems.
- Resource consumption is very low, and the monitoring tool itself imposes minimal performance overhead.
- It is possible to determine the success of communications in real time and send alerts for failed attempts.
Of course, compared to commercial eBPF-based network monitoring products, this implementation is relatively simple and limited in functionality.
However, considering the time and effort required for development, the results were quite satisfactory.
It was impressive to see that even a simple structure can enable a meaningful level of network state monitoring.