파일 읽어오기
pd.read_csv(’파일 경로’, ‘index’, parse_dates= True)
- index는 index_col = ‘Date’ 이용
- parse_dates=True → 일반 date 인덱스를 DatetimeIndex로 전환
그래프 그리기
df.plot.hist(bins, edgecolor).autoscale(enable,axis, tight)
- histogram
- bins : 그래프 구간을 몇개로 나눌 것인지 (int)
- edgecolor: 테두리 색깔 (char)
- axis: x축, y축 scaling (x, y, both)
- tight: 그래프를 전체 크기에 맞출 것인지 (True, False)
df.plot.bar(stacked)
- bar chart
- stacked: 값을 누적할 것인지 (True, False)
- df.plot.barh : 가로 막대 그래
df.plot.area()
- area chart (누적 차트)
df.plot.box()
- box plot
df.plot.pie()
- pie chart
df.plot.line(figsize, ls, c, lw)
- figsize: 그래프 사이즈
- ls: 선 모양
- c: 그래프 색
- lw: 선 굵기
그래프 설정
.set(xlabel, ylabel)
.legend(loc, bbox_to_anchor=())
Ex)
#ex)
ax = df['Close'].plot(figsize=(12,6), title='Title')
ax.autoscale(axis='x', tight = True)
ax.set(xlabel='Xlabel', ylabel='Ylabel')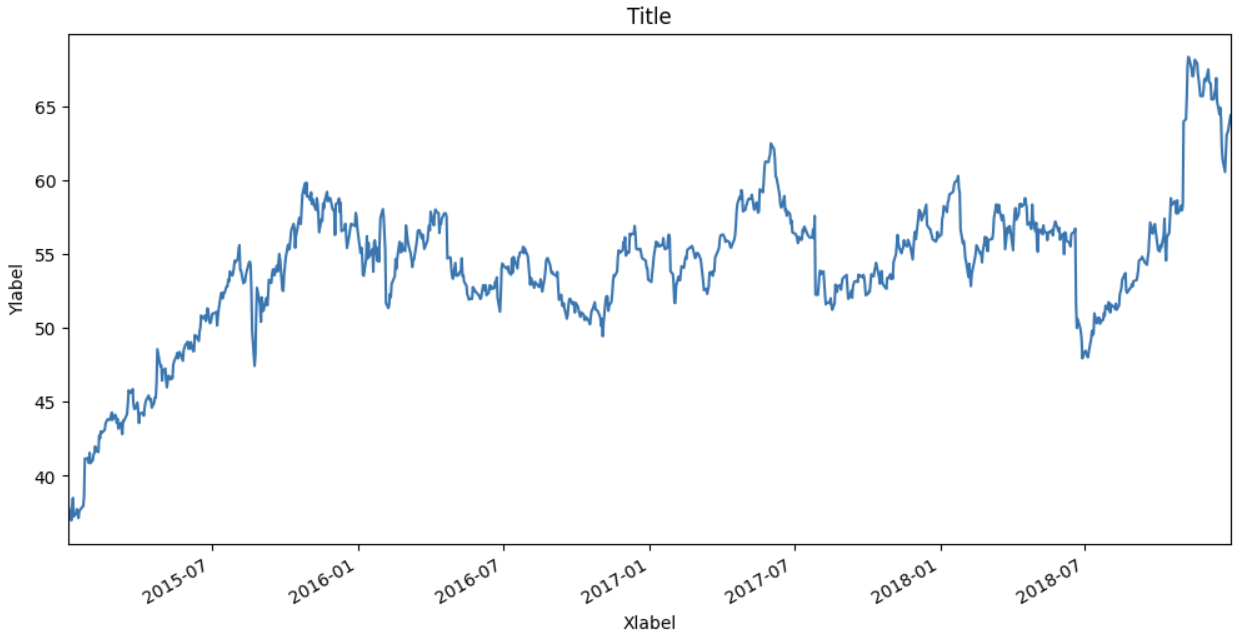
#ex)
df['Close']['2017-01-01':'2017-12-31'].plot()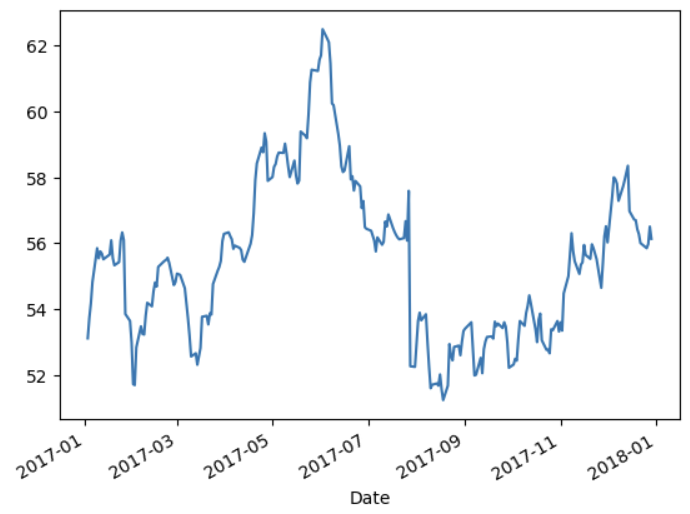
참고 자료
https://pandas.pydata.org/pandas-docs/stable/reference/api/pandas.DataFrame.plot.html
https://colab.research.google.com/drive/14bYRPSSa6R2AsrX-07_3MOJHCsqLKst1#scrollTo=E4PGEF4cO2hH