Riot API 를 이용해서 재밌는 것을 만드는 중이다.
팀원의 딜량을 그래프로 띄우려는데 예전부터 재밌을 것 같다고 사용했던 그래프 라이브러리 Nivo를 사용해봤다.
이 글은 Nivo에 대한 다양한 정보보다는 내가 사용한 부분 만을 다룰 예정이다.
Nivo의 홈페이지에 접속하면 다양한 그래프를 선택할 수 있는데
나는 Nivo의 다양한 그래프 중에서도 bar 형식의 그래프를 사용했다.
Nivo 설치
yarn add @nivo/core @nivo/bar
Nivo Bar 코드
import { ResponsiveBar } from '@nivo/bar'

// make sure parent container have a defined height when using
// responsive component, otherwise height will be 0 and
// no chart will be rendered.
// website examples showcase many properties,
// you'll often use just a few of them.
const MyResponsiveBar = ({ data /* see data tab */ }) => (
    <ResponsiveBar
        data={data}
        keys={[
            'hot dog',
            'burger',
            'sandwich',
            'kebab',
            'fries',
            'donut'
        ]}
        indexBy="country"
        margin={{ top: 50, right: 130, bottom: 50, left: 60 }}
        padding={0.3}
        valueScale={{ type: 'linear' }}
        indexScale={{ type: 'band', round: true }}
        colors={{ scheme: 'nivo' }}
        defs={[
            {
                id: 'dots',
                type: 'patternDots',
                background: 'inherit',
                color: '#38bcb2',
                size: 4,
                padding: 1,
                stagger: true
            },
            {
                id: 'lines',
                type: 'patternLines',
                background: 'inherit',
                color: '#eed312',
                rotation: -45,
                lineWidth: 6,
                spacing: 10
            }
        ]}
        fill={[
            {
                match: {
                    id: 'fries'
                },
                id: 'dots'
            },
            {
                match: {
                    id: 'sandwich'
                },
                id: 'lines'
            }
        ]}
        borderColor={{
            from: 'color',
            modifiers: [
                [
                    'darker',
                    1.6
                ]
            ]
        }}
        axisTop={null}
        axisRight={null}
        axisBottom={{
            tickSize: 5,
            tickPadding: 5,
            tickRotation: 0,
            legend: 'country',
            legendPosition: 'middle',
            legendOffset: 32
        }}
        axisLeft={{
            tickSize: 5,
            tickPadding: 5,
            tickRotation: 0,
            legend: 'food',
            legendPosition: 'middle',
            legendOffset: -40
        }}
        labelSkipWidth={12}
        labelSkipHeight={12}
        labelTextColor={{
            from: 'color',
            modifiers: [
                [
                    'darker',
                    1.6
                ]
            ]
        }}
        legends={[
            {
                dataFrom: 'keys',
                anchor: 'bottom-right',
                direction: 'column',
                justify: false,
                translateX: 120,
                translateY: 0,
                itemsSpacing: 2,
                itemWidth: 100,
                itemHeight: 20,
                itemDirection: 'left-to-right',
                itemOpacity: 0.85,
                symbolSize: 20,
                effects: [
                    {
                        on: 'hover',
                        style: {
                            itemOpacity: 1
                        }
                    }
                ]
            }
        ]}
        role="application"
        ariaLabel="Nivo bar chart demo"
        barAriaLabel={function(e){return e.id+": "+e.formattedValue+" in country: "+e.indexValue}}
    />
)
이런식의 프리셋을 제공해준다.
일단 컴포넌트 추가를 했지만 여기서 어떻게 해야할지 막막해서 이것저것 만져봤다.
먼저
const MyResponsiveBar = ({ data /* see data tab */ }) => (
    <ResponsiveBar
        data={data}
        keys={[
            'hot dog',
            'burger',
            'sandwich',
            'kebab',
            'fries',
            'donut'
        ]}
요 부분에서 data가 누가봐도 가장 중요하다는 것을 알 수 있겠다.
그래서 data를 어떤 형식으로 받아와야 하는지 뜯어봤다.
export interface BarDatum {
    [key: string]: string | number;
}
export interface DataProps<RawDatum extends BarDatum> {
    data: RawDatum[];
}
타입스크립트로 프로젝트를 진행 중이라서 interface를 생성해줘야한다.
export interface UserDamageInfo {
  [key: string]: string | number;
}

let userDamage: object[] = [];
/// map
userDamage[i] = { [user.championName]: user.totalDamageDealtToChampions };


///Nivo Bar Graph Component
type UserProps = {
  data: UserDamageInfo[];
};

/// [key: string]: string | number;
export const DealGraph = ({ data }: UserProps) => {

  const dataKeys = data.map((key: object) => {
    return Object.keys(key);
  });

  return (
    <ResponsiveBar
      data={data}
      keys={[dataKeys[0]]}
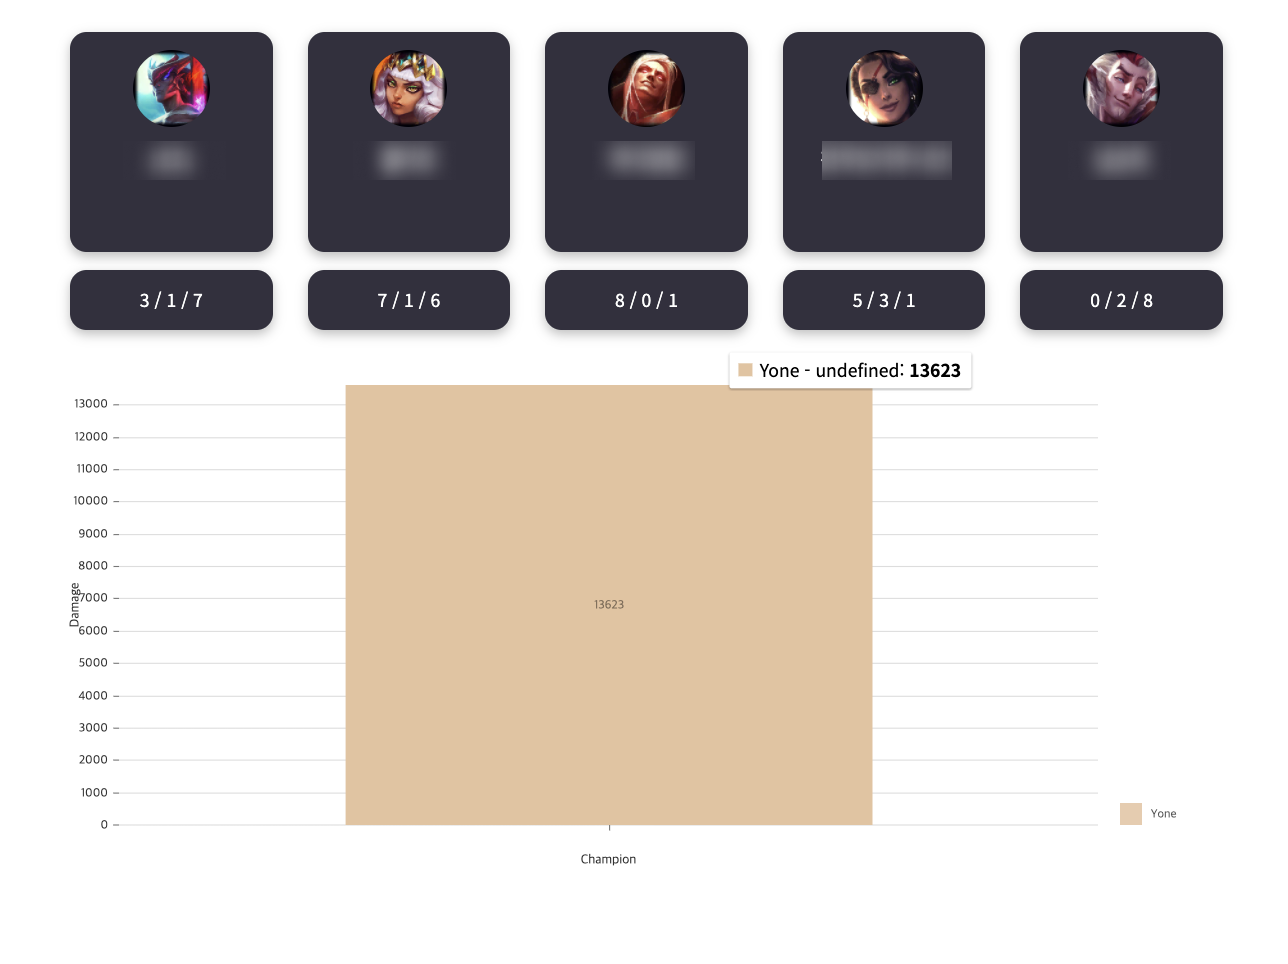
짠! 요네의 딜량이 나와버렸다. 다음 글에서는 다른 챔피언들의 딜량도 함께 표시하고 디자인도 수정해보겠다.

이것 저것 다해보는 삶