1. QQ-plot(Quantile Quantile plot)
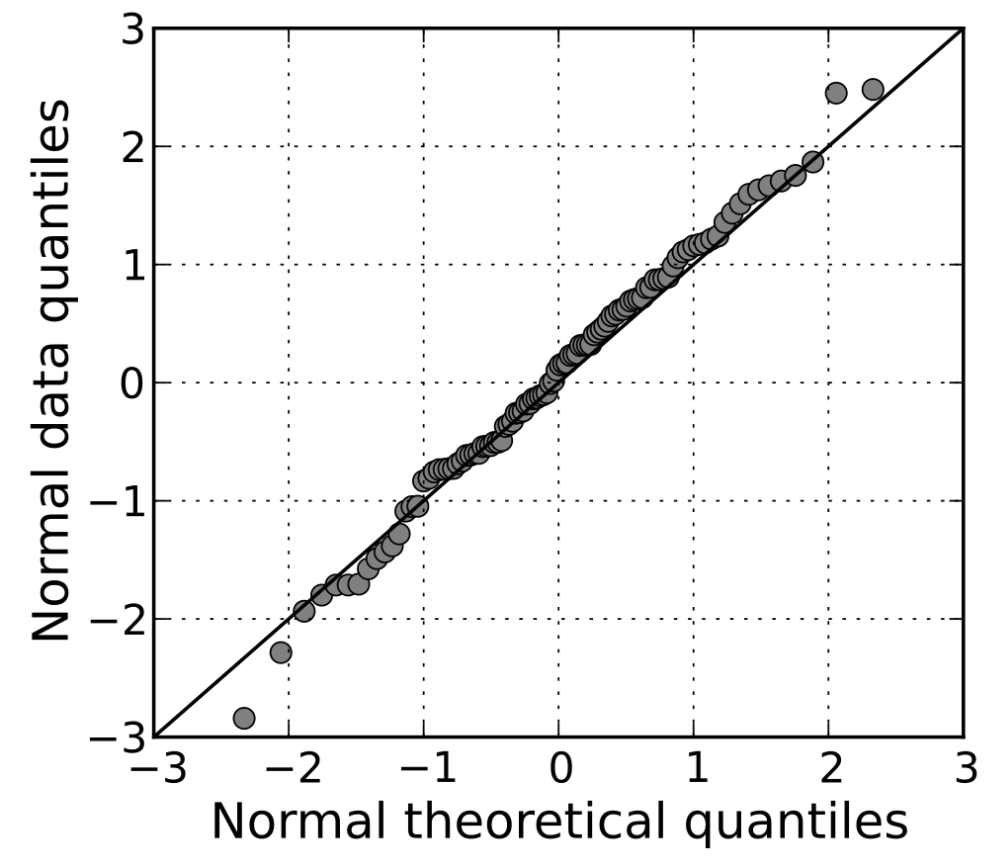
(완전한 정규분포를 이룰 때)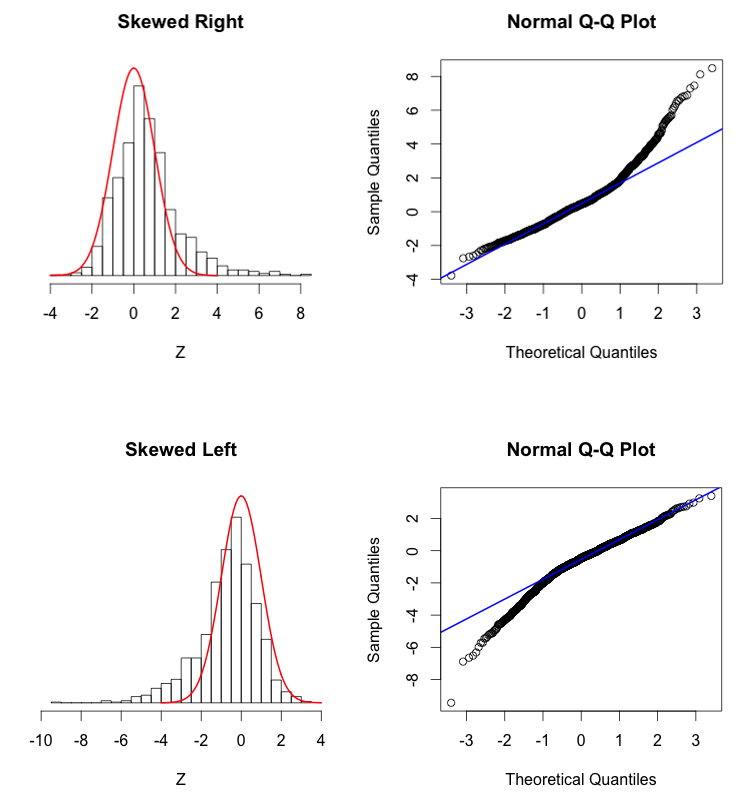
(skewed가 있을 떄)- 데이터의 정규성을 파악할 때 사용한다.
- 이론적으로 데이터가 정규성을 따를 때 quantiles 값을 x축으로, 실제 데이터의 quantiles 값을 y축으로 표현한다.
- 두개의 다른 datasets이 같은 분포를 같는지 확인하는 데 쓰인다.
- 하지만 보통 어떤 하나의 dataset이 특정 분포를 따르는지 확인할려고 사용한다.
- z-score란 자료가 평균으로부터 표준편차의 몇 배 만큼 떨어져 있는지 보여준다.
2. Pandas.DataFrame.apply()
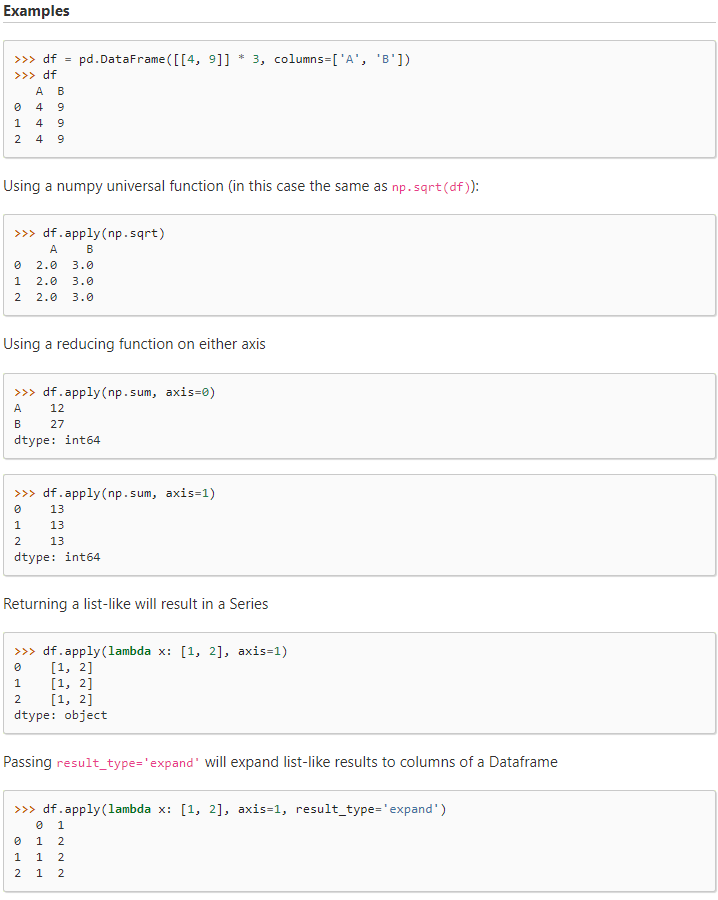
- Call a function along an axis of the DataFrame.
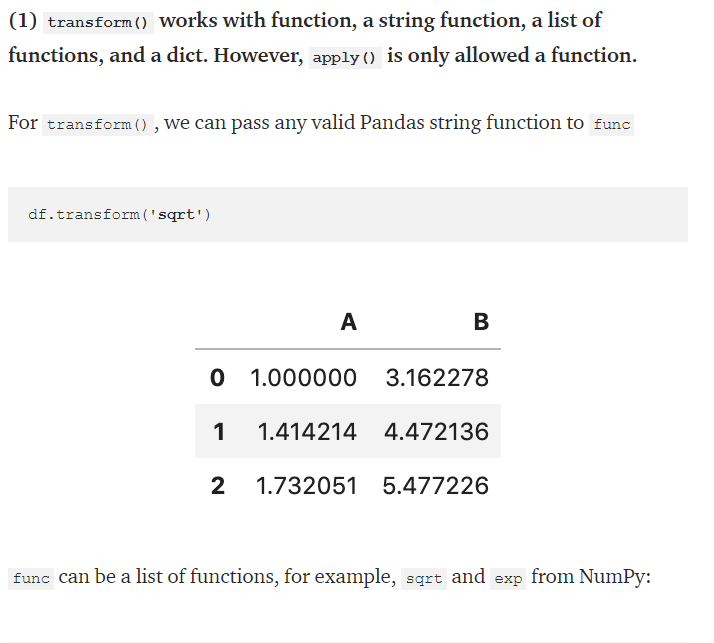
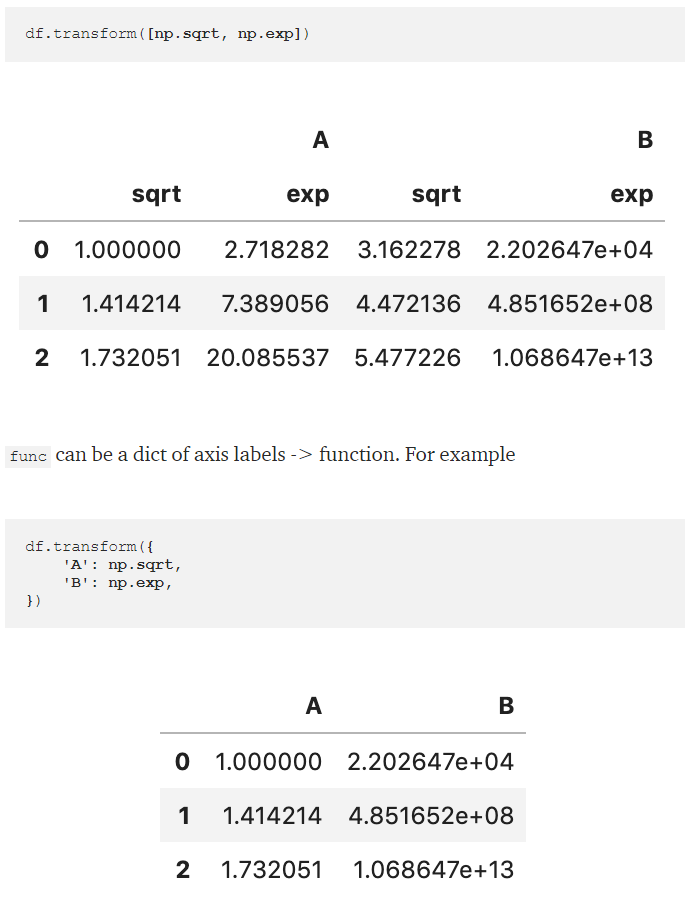
3. Pandas.DataFrame.transform()
- Call a function on self producing a DataFrame with transformed values.
4. apply()와 transform()의 차이점
(사진출처 : https://towardsdatascience.com/difference-between-apply-and-transform-in-pandas-242e5cf32705)
1. transform() work with function, a string function, a list of functions, and a dict. However, apply() is only allowed with function.
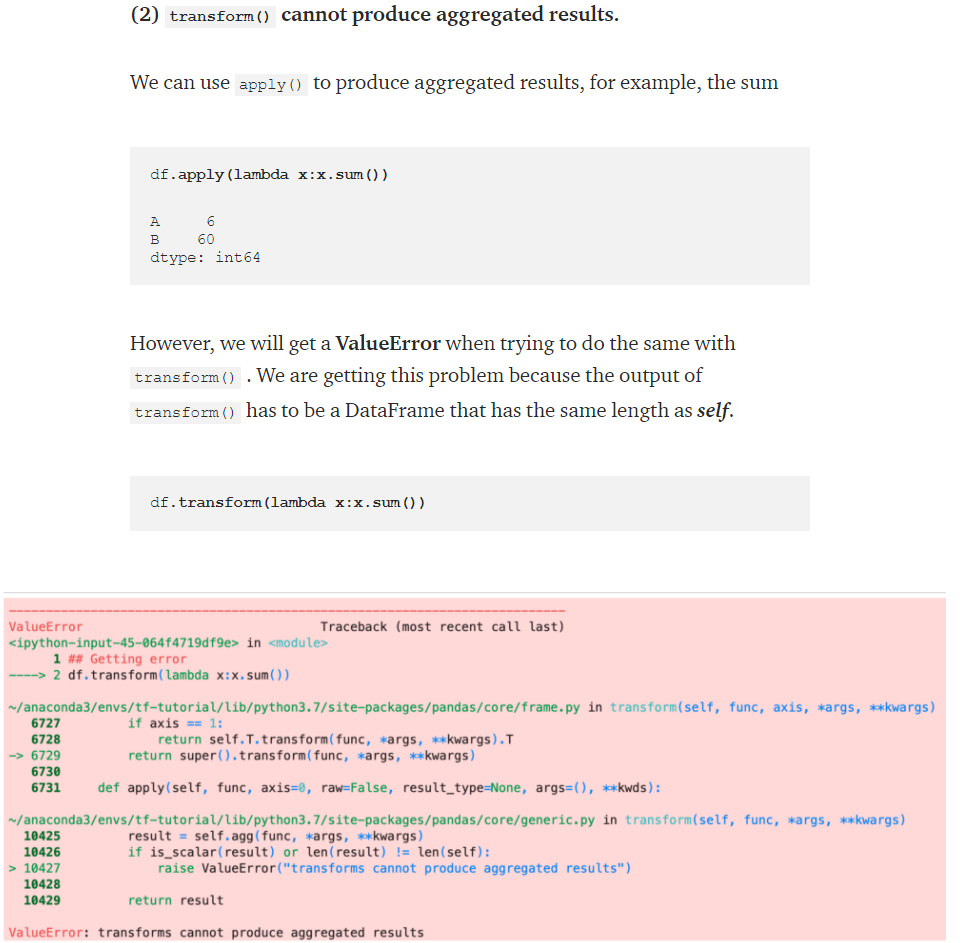
2. transform() cannot produce aggregated results.
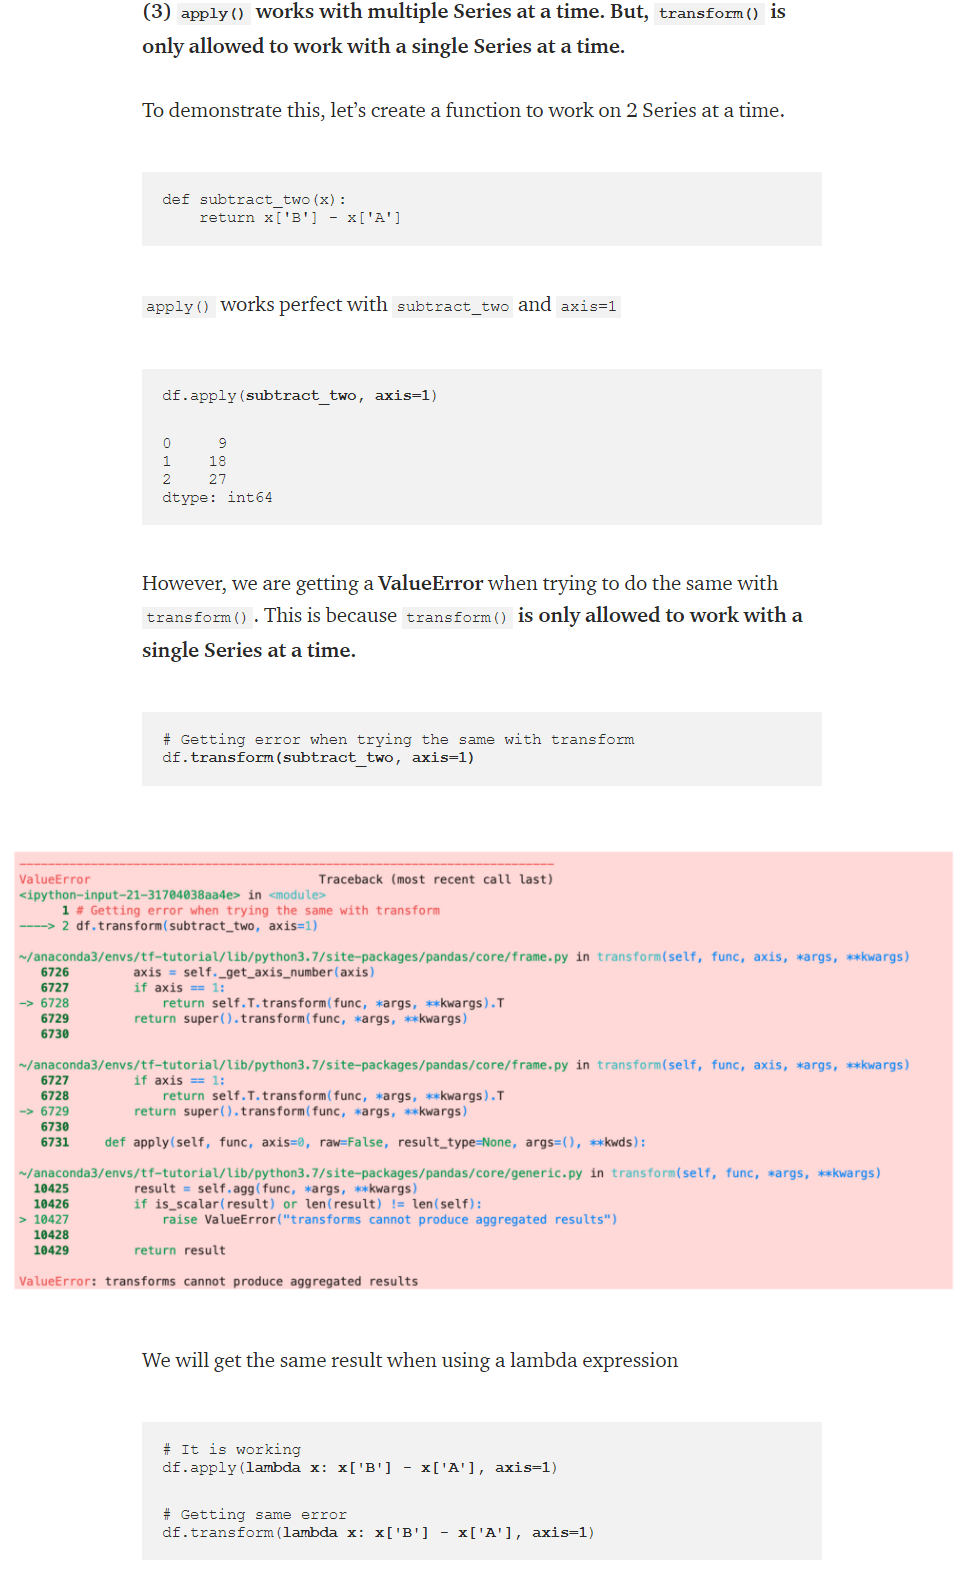
3. apply() works with multiple Series at a time. But, transform() is only allowed to work with a single Series at a time.
5. Pandas.DataFrame.astype()
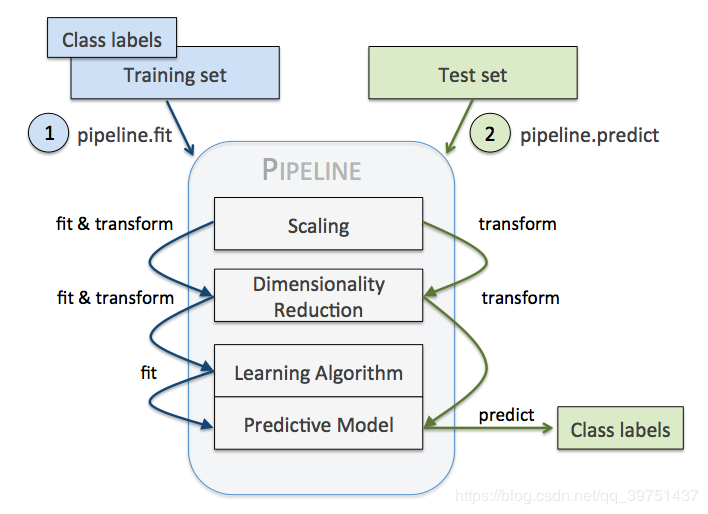
6. Sklearn.pipeline()
7. cross_val_score()
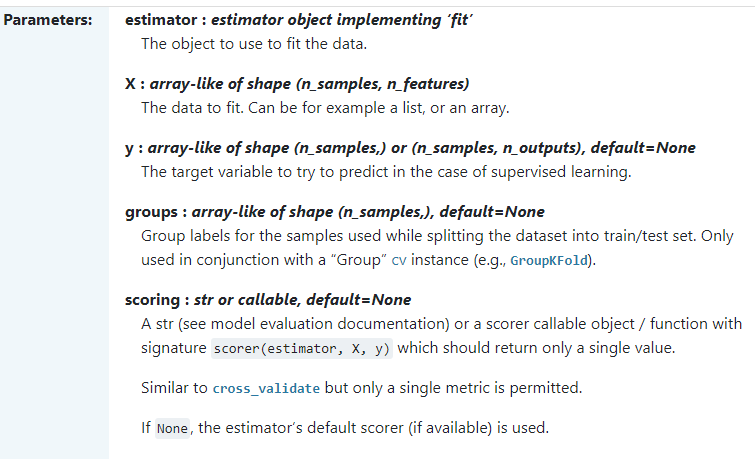
- Evaluate a score by cross-validation
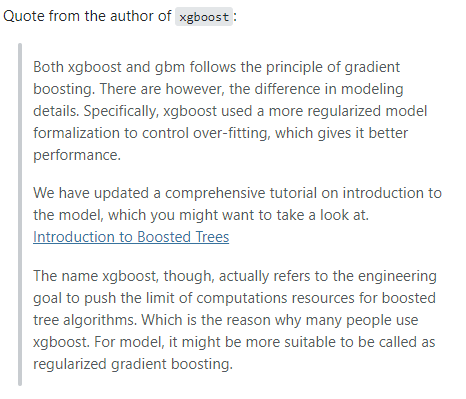
8. Key differences GBM vs XGBOOST
9. BaseEstimator, RegressorMixin, TransformerMixin
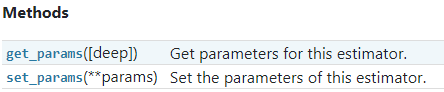
1. BaseEstimator
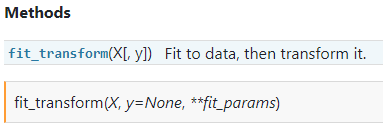
2. TransformerMixin
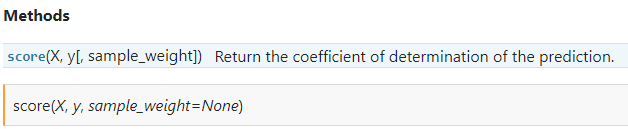
3. RegressorMixin
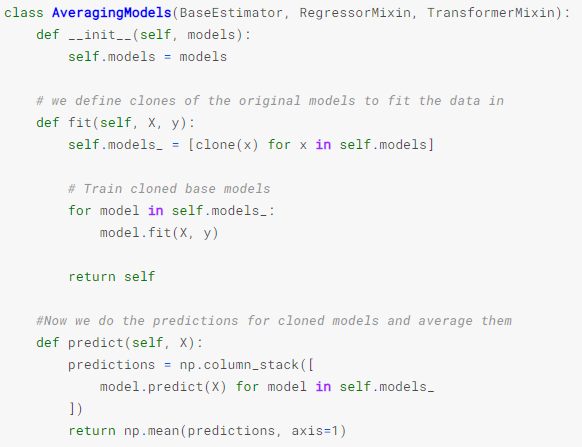
어떤 한 kaggle notebook에서 다음과 같은 class를 보았다.
여러개의 모델을 한 번에 학습시키고 predictions의 평균을 반환하는 기능을 하는 것 같다.
그리고 이 클래스는
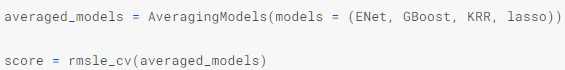
이렇게 사용 되었고 averaged_models는 rmsle_cv라는 함수안으로 들어가 cross_val_score()의 estimator 인자로 전달된다.

https://github.com/Coaspe