
들어가기 전...
한참을 공부하고 드디어 개발을 시작하는 줄 알았다... 하지만 제품에 안정성 확보를 위해 모니터링 시스템을 구축해야 하는데 너무 바빠서 대신 해줄 사람이 필요하다고 하셨다. 그래서 해당 자료를 조사하고 환경을 구축하는 일을 대신 담당하게 됐다.
환경
OS - Windows 10
DB - Postgresql 14
Server - Java 8, Spring boot 2.2.9
Prometheus - 2.37.0
grafana - 9
postgresql exporter - 0.10.1
개념
프로메테우스(Prometheus)
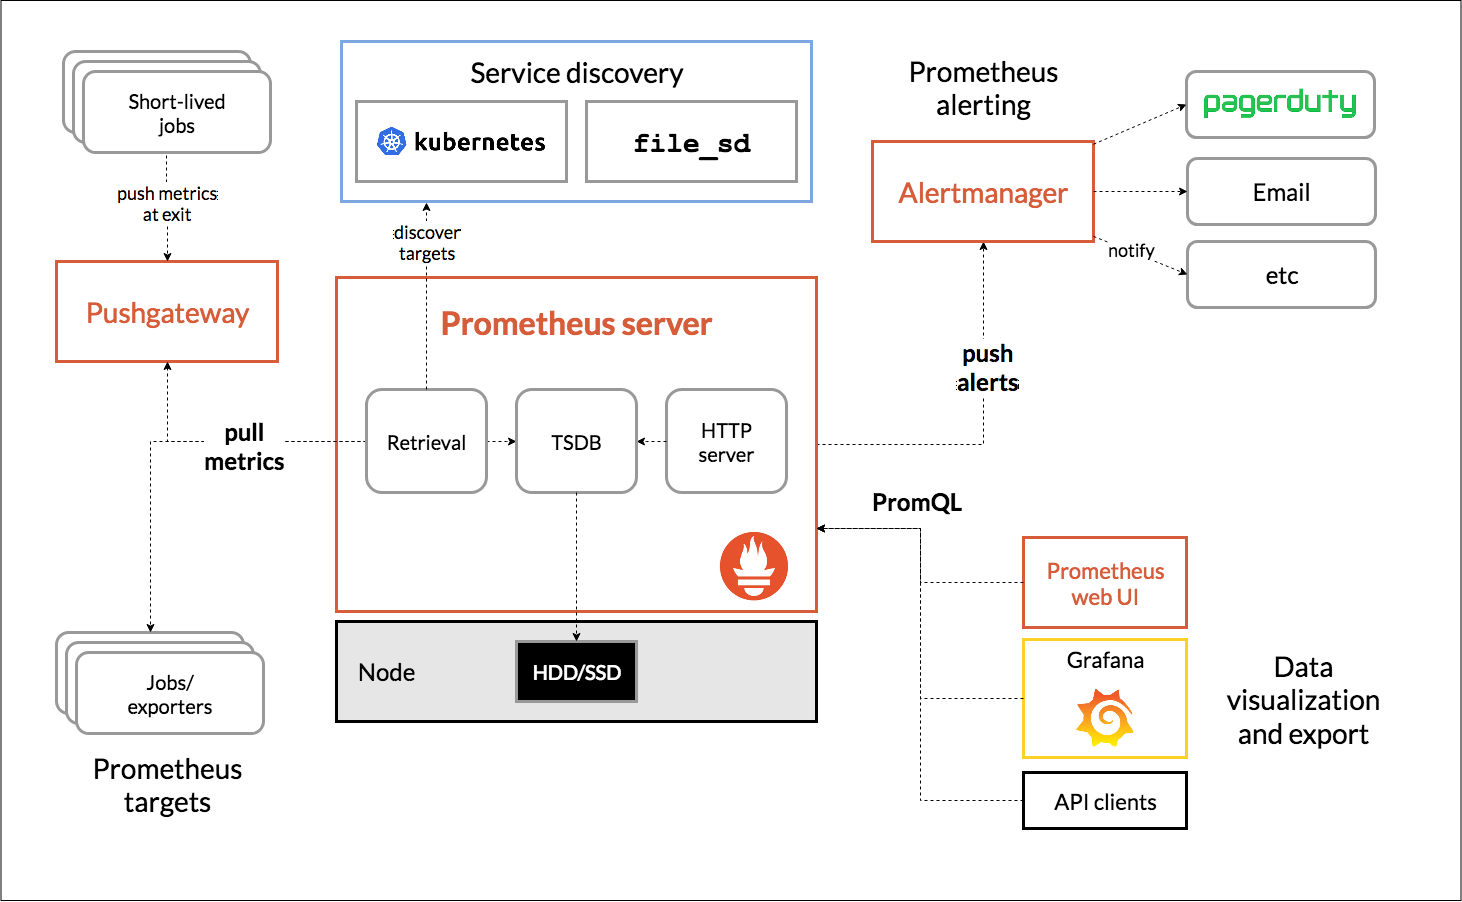
공식 Docs에 따르면 오픈 소스 시스템 모니터링 및 경고 툴킷이라고 나와 있다. 또한 메트릭(Metric) 정보를 시계열 데이터 베이스(TSDB)에 저장하여 사용한다고 되어 있다. 또한 이 정보는 Key-Value 형태로 묶여있고, PromQL을 사용하여 활용할 수 있다.
또다른 특징으로 다른 모니터링 시스템은 모니터링 하는 시스템에서 데이터가 발생하면 모니터링 서버로 Push 하는 형태로 동작한다고 한다. 하지만, 프로메테우스는 데이터가 필요할 떄 Prometheus 서버에서 Pull 하는 방식으로 동작한다. 이로 인해 많은 서버가 존재해도 Promtheus에 과부하가 걸리지 않을 수 있다고 한다.
메트릭(Metrics)
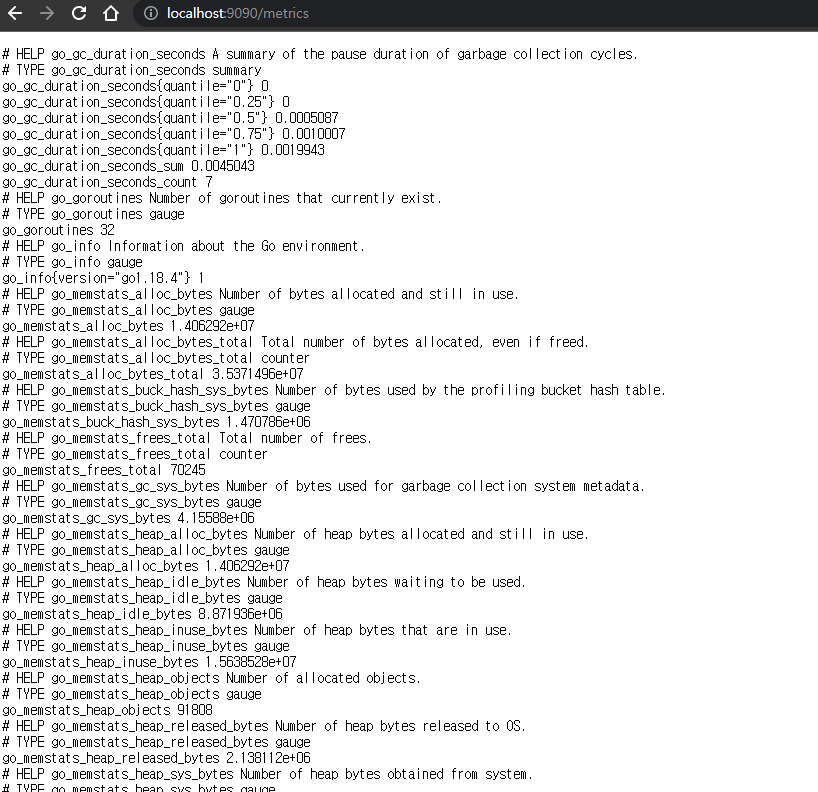
위에서 언급한 것과 같이 Prometheus는 Pull 방식을 통해 데이터를 수집한다. 이 때 HTTP ENDPOINT를 통해 접근을 하는데
예를 들어 /api/testservice/metric 과 같이 해당 포인트를 열어 놓는다면, Prometheus가 HTTP 요청을 통해 데이터를 수집할 수 있다.
Exporter
위와 같이 모니터링 하고자 하는 서버에서 HTTP ENDPOINT를 열어 놓아야 Prometheus에서 정상적으로 데이터를 수집할 수 있다. 각종 환경에서 이런 시스템을 구축해 놓은 것이 Exporter이다.
공식 Docs를 가면 다양한 종류의 Exporter를 찾을 수 있고, 나는 Postgersql에 정보를 수집하기 위해 Postgresql exporter를 사용했다.
Postgersql Exporter는 go 언어로 작성되어 있고, 환경 변수에 datasource를 설정하여 사용할 수 있다.
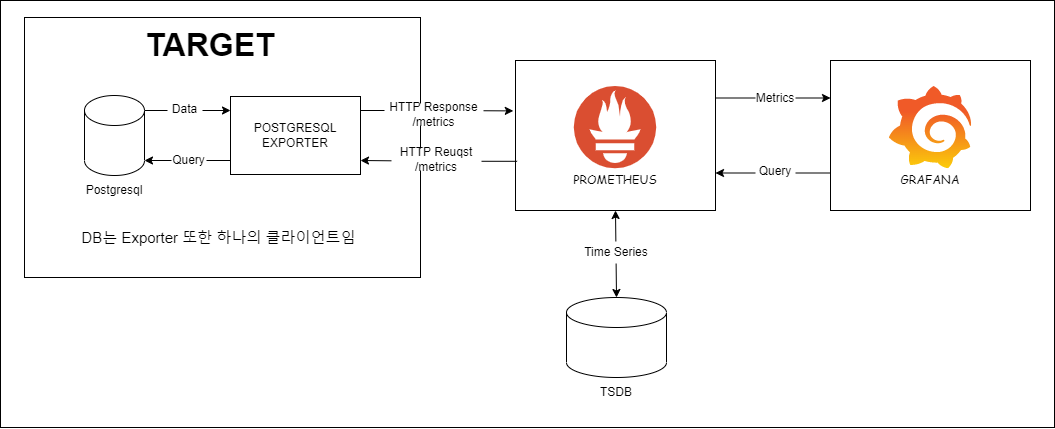
Postgresql Exporter는 Postgresql 에서 지원하는 설정을 이용하는 쿼리를 통해 각종 정보를 수집하여 메트릭으로 제공한다. (이건 DB 입장에서 볼 때 Exporter 또한 하나의 Client 처럼 동작하는 거 같다.)
다음 그림은 내가 구축한 모니터링 시스템의 구조를 나타낸 것이다.
사용법
Prometheus에 존재하는 yml 설정 파일을 통해 어떤 노드에 연결하여 수집할 지 정할 수 있다.
(Default)
# my global config
global:
 scrape_interval: 15s # Set the scrape interval to every 15 seconds. Default is every 1 minute.
 evaluation_interval: 15s # Evaluate rules every 15 seconds. The default is every 1 minute.
 # scrape_timeout is set to the global default (10s).
# Alertmanager configuration
alerting:
 alertmanagers:
 - static_configs:
 - targets:
 # - alertmanager:9093
# Load rules once and periodically evaluate them according to the global 'evaluation_interval'.
rule_files:
 # - "first_rules.yml"
 # - "second_rules.yml"
# A scrape configuration containing exactly one endpoint to scrape:
# Here it's Prometheus itself.
scrape_configs:
 # The job name is added as a label `job=<job_name>` to any timeseries scraped from this config.
 - job_name: "prometheus"
 # metrics_path defaults to '/metrics'
 # scheme defaults to 'http'.
 static_configs:
 - targets: ["localhost:9090"]
변경 후
#
global:
 # 15 Pull
 scrape_interval: 15s
#
scrape_configs:
 # job, group, instance
 - job_name: "prometheus"
 static_configs:
 # /metrics default -> localhost:9090/metrics
 # metrics
 - targets: ["localhost:9090"]

 # Postgresql Exporter metrics
 - job_name: "postgres"
 static_configs:
 - targets: [IP:PORT] # DB server의 IP:PORT (postgresql exporter는 9187 포트 사용)
Reference
https://prometheus.io/docs/prometheus/latest/getting_started/