yfinance API를 이용하여 만든 자산 관리 프로그램
해외주식, 국내주식, 연금저축펀드, 비트코인, 현금, 부채, 투자원금 목록은 수동으로 입력해주어야 한다.
Google Collaboratory, jupyter notebook에서 작성하였으며, 구글 드라이브와 연동하여 업데이트된 자산현황을 읽어온다.
서로 다른 계좌의 자산을 통합하여 현재 어떤 비중으로 투자하고 있는지 볼 수 있고, 1월 1일부터 자산의 변화를 볼 수 있다.
매일의 주가, 비트코인 가격 및 환율을 yfinance API를 통해 입력받아, 종가 기준으로 자산평가액을 계산한다.
현재 연금 저축 펀드를 통해 투자하고 있는 ETF 두 종목은 yfinance에서 가장 최근 거래일의 종가만을 제공하고 있기 때문에, 프로그램을 실행할 때마다 각 종목의 주가를 저장 및 업데이트 하도록 구현했다.
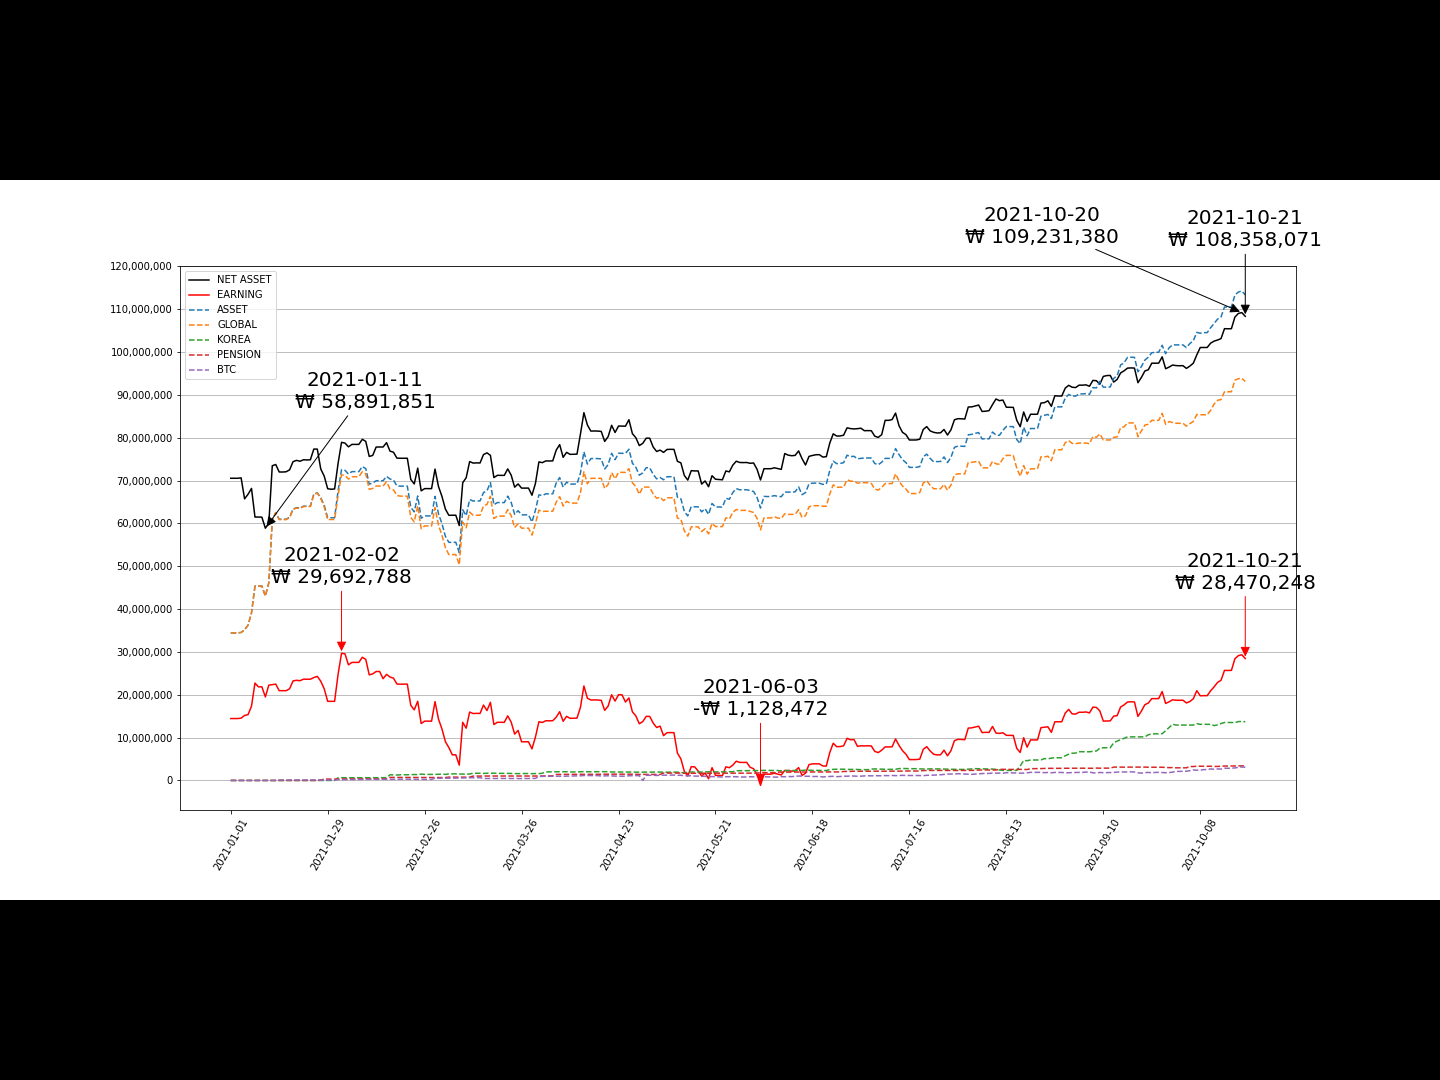
그래프에 최저/최고/현재 자산과 최저/최고/현재 수익을 표시했다.
과거의 거래 기록을 완벽하게 복원하지 못하여 1월의 기록에는 상당한 오류가 있는데, 시간이 널널할 때 수정할 계획.
실행결과
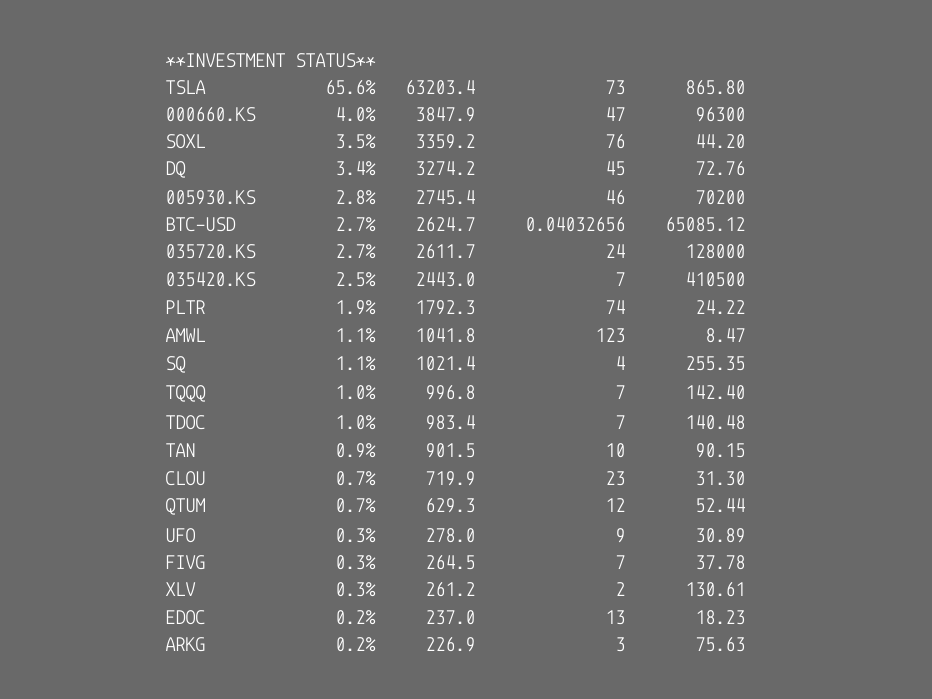
INVESTMENT_STATUS.PNG
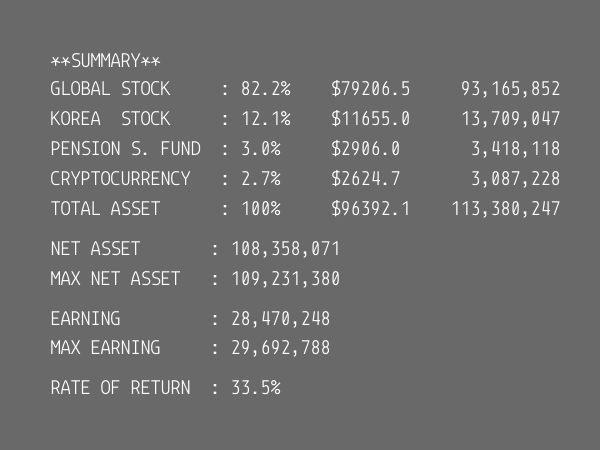
SUMMARY.PNG
Asset.png
코드
#code
!pip install yfinance
from pandas_datareader import data as pdr
import yfinance as yf
import datetime
import matplotlib.pyplot as plt
from PIL import Image, ImageDraw, ImageFont
import os
from google.colab import drive
drive.mount('/content/drive')
os.system('cp /content/drive/MyDrive/Stock_Record/Stock_Own_Record.txt /content/drive/MyDrive/Stock_Record/Stock_Own_Record_backup.txt')
os.system('cp /content/drive/MyDrive/Stock_Record/Stock_Price_Record.txt /content/drive/MyDrive/Stock_Record/Stock_Price_Record_backup.txt')
now = datetime.datetime.now()
start_date = datetime.date(2021, 1, 1)
now_date = now.strftime('%Y-%m-%d')
f = open('/content/drive/MyDrive/Stock_Record/Money_Debt_Record.txt', 'r')
money = {}
housing = {}
debt = {}
global_deposit = {}
korea_deposit = {}
pension_deposit = {}
principal = {}
i = -1
while True:
    line = f.readline()
    if not line:
        break
    if line[0] == '#':
        i += 1
        continue
    if i == 0:
        money[line.split()[0]] = float(line.split()[1])
    if i == 1:
        housing[line.split()[0]] = float(line.split()[1])
    if i == 2:
        debt[line.split()[0]] = float(line.split()[1])
    if i == 3:
        global_deposit[line.split()[0]] = float(line.split()[1])
    if i == 4:
        korea_deposit[line.split()[0]] = float(line.split()[1])
    if i == 5:
        pension_deposit[line.split()[0]] = float(line.split()[1])
    if i == 6:
        principal[line.split()[0]] = float(line.split()[1])
f.close()
f = open('/content/drive/MyDrive/Stock_Record/Stock_Own_Record.txt', 'r')
ticker = []
stock_type = []
stock_own = []
i = -1
while True:
    line = f.readline()
    if not line:
        break
    if line[0] == '#':
        ticker.append(line.split('#')[1])
        stock_type.append(int(line.split('#')[2].split('\n')[0]))
        i += 1
        stock_own.append({})
        continue
    stock_own[i][line.split()[0]] = float(line.split()[1])
f.close()
f = open('/content/drive/MyDrive/Stock_Record/Stock_Price_Record.txt', 'r')
stock_price = []
for i in range(len(ticker)):
    stock_price.append({})
i = -1
while True:
    line = f.readline()
    if not line:
        break
    if line[0] == '#':
        i += 1
        continue
    stock_price[i][line.split()[0]] = float(line.split()[1])
f.close()
yf.pdr_override()
new_stock_price = []
for i in ticker:
    new_stock_price.append(pdr.get_data_yahoo(i, start=start_date, end=now_date))
for i in range(len(ticker)):
    for j in new_stock_price[i].index:
        stock_price[i][j.strftime('%Y-%m-%d')] = float('{:.2f}'.format(new_stock_price[i].at[j,'Close']))
stock_price[16]['2020-12-31'] = 25.11
f = open('/content/drive/MyDrive/Stock_Record/Stock_Price_Record.txt', 'w')
for i in range(len(ticker)):
    f.write('#'+ticker[i]+'\n')
    for j in stock_price[i].keys():
        f.write(str(j) + ' ')
        f.write(str('{:.2f}'.format(stock_price[i][j])))
        f.write('\n')
f.close()

dollar_price = yf.download(['USDKRW=X'],start=start_date, end=now_date)
dollar_price_record = {}
for i in dollar_price.index:
    dollar_price_record[i.strftime('%Y-%m-%d')] = float('{:.2f}'.format(dollar_price.at[i,'Close']))
print()
dollarperwon = dollar_price.at[dollar_price.index[-1], 'Close']
amount = []
amount_by_type = [0, 0, 0, 0]
total_amount = 0
for i in range(len(ticker)):
    temp = stock_price[i][list(stock_price[i].keys())[-1]] * stock_own[i][list(stock_own[i].keys())[-1]]
    if stock_type[i] == 1 or stock_type[i] == 2:
        temp /= dollarperwon
    amount.append(temp)
    amount_by_type[stock_type[i]] += temp
    total_amount += temp
amount_by_type[0] += global_deposit[list(global_deposit.keys())[-1]]
amount_by_type[1] += korea_deposit[list(korea_deposit.keys())[-1]]/dollarperwon
amount_by_type[2] += pension_deposit[list(pension_deposit.keys())[-1]]/dollarperwon
total_amount_plus_deposit = total_amount + global_deposit[list(global_deposit.keys())[-1]] + korea_deposit[list(korea_deposit.keys())[-1]]/dollarperwon + pension_deposit[list(pension_deposit.keys())[-1]]/dollarperwon
sorted_amount_index = list(reversed(sorted(range(len(amount)), key=lambda k: amount[k])))
print('**INVESTMENT STATUS**')
for i in sorted_amount_index:
    if stock_own[i][list(stock_own[i].keys())[-1]] == 0:
        break
    if stock_type[i] == 0:
        print('{}{:10.1f}%{:10.1f}{:15.0f}  {:10.2f}'.format('{0: <10}'.format(ticker[i]), amount[i]/total_amount*100, amount[i], stock_own[i][list(stock_own[i].keys())[-1]], stock_price[i][list(stock_price[i].keys())[-1]]))
    if stock_type[i] == 1 or stock_type == 2:
        print('{}{:10.1f}%{:10.1f}{:15.0f}  {:10.0f}'.format('{0: <10}'.format(ticker[i]), amount[i]/total_amount*100, amount[i], stock_own[i][list(stock_own[i].keys())[-1]], stock_price[i][list(stock_price[i].keys())[-1]]))
    if stock_type[i] == 3:
        print('{}{:10.1f}%{:10.1f}{:15.8f}  {:10.2f}'.format('{0: <10}'.format(ticker[i]), amount[i]/total_amount*100, amount[i], stock_own[i][list(stock_own[i].keys())[-1]], stock_price[i][list(stock_price[i].keys())[-1]]))
print()
print('**SUMMARY**')
print('GLOBAL STOCK     : {:.1f}%\t${:.1f}\t₩{}'.format(amount_by_type[0]/total_amount_plus_deposit*100, amount_by_type[0], '{:,}'.format(int(amount_by_type[0]*dollarperwon))))
print('KOREA  STOCK     : {:.1f}%  \t${:.1f}   \t₩{}'.format(amount_by_type[1]/total_amount_plus_deposit*100, amount_by_type[1], '{:,}'.format(int(amount_by_type[1]*dollarperwon))))
print('PENSION S. FUND  : {:.1f}%  \t${:.1f}   \t₩{}'.format(amount_by_type[2]/total_amount_plus_deposit*100, amount_by_type[2], '{:,}'.format(int(amount_by_type[2]*dollarperwon))))
print('CRYPTOCURRENCY   : {:.1f}%  \t${:.1f}   \t₩{}'.format(amount_by_type[3]/total_amount_plus_deposit*100, amount_by_type[3], '{:,}'.format(int(amount_by_type[3]*dollarperwon))))
print('TOTAL ASSET      : 100%   \t${:.1f}\t₩{}'.format(total_amount_plus_deposit, '{:,}'.format(int(total_amount_plus_deposit*dollarperwon))))
cur = start_date
now = datetime.date(now.year, now.month, now.day)
cur_stock_price = []
cur_stock_own = []
for i in range(len(ticker)):
    cur_stock_price.append(stock_price[i][list(stock_price[i].keys())[0]])
    cur_stock_own.append(stock_own[i][list(stock_own[i].keys())[0]])
cur_money = money[list(money.keys())[0]]
cur_housing = housing[list(housing.keys())[0]]
cur_debt = debt[list(debt.keys())[0]]
cur_global_deposit = global_deposit[list(global_deposit.keys())[0]]
cur_korea_deposit = korea_deposit[list(korea_deposit.keys())[0]]
cur_pension_deposit = pension_deposit[list(pension_deposit.keys())[0]]
cur_dollarperwon = dollar_price_record[list(dollar_price_record.keys())[0]]
cur_principal = principal[list(principal.keys())[0]]
asset_axis = []
invest_axis = []
earning_axis = []
global_axis = []
korea_axis = []
pension_axis = []
btc_axis = []
date_axis = []
day_count = 0
for_xaxis = []
datetime_axis = []
earning_rate_axis = []
principal_axis = []
while cur <= now:
    for i in range(len(ticker)):
        if cur.strftime('%Y-%m-%d') in list(stock_price[i].keys()):
            cur_stock_price[i] = stock_price[i][cur.strftime('%Y-%m-%d')]
        if cur.strftime('%Y-%m-%d') in list(stock_own[i].keys()):
            cur_stock_own[i] = stock_own[i][cur.strftime('%Y-%m-%d')]
    if cur.strftime('%Y-%m-%d') in list(money.keys()):
        cur_money = money[cur.strftime('%Y-%m-%d')]
    if cur.strftime('%Y-%m-%d') in list(housing.keys()):
        cur_housing = housing[cur.strftime('%Y-%m-%d')]
    if cur.strftime('%Y-%m-%d') in list(debt.keys()):
        cur_debt = debt[cur.strftime('%Y-%m-%d')]
    if cur.strftime('%Y-%m-%d') in list(global_deposit.keys()):
        cur_global_deposit = global_deposit[cur.strftime('%Y-%m-%d')]
    if cur.strftime('%Y-%m-%d') in list(korea_deposit.keys()):
        cur_korea_deposit = korea_deposit[cur.strftime('%Y-%m-%d')]
    if cur.strftime('%Y-%m-%d') in list(pension_deposit.keys()):
        cur_pension_deposit = pension_deposit[cur.strftime('%Y-%m-%d')]
    if cur.strftime('%Y-%m-%d') in list(dollar_price_record.keys()):
        cur_dollarperwon = dollar_price_record[cur.strftime('%Y-%m-%d')]
    if cur.strftime('%Y-%m-%d') in list(principal.keys()):
        cur_principal = principal[cur.strftime('%Y-%m-%d')]
    temp = 0
    temp_invest = 0
    temp_asset = 0
    temp_global = 0
    temp_korea = 0
    temp_pension = 0
    temp_btc = 0
    temp_earning = 0
    for i in range(len(ticker)):
        if stock_type[i] == 0:
            temp_invest += cur_stock_price[i] * cur_stock_own[i] * cur_dollarperwon
            temp_global += cur_stock_price[i] * cur_stock_own[i] * cur_dollarperwon
        elif stock_type[i] == 1:
            temp_invest += cur_stock_price[i] * cur_stock_own[i]
            temp_korea += cur_stock_price[i] * cur_stock_own[i]
        elif stock_type[i] == 2:
            temp_invest += cur_stock_price[i] * cur_stock_own[i]
            temp_pension += cur_stock_price[i] * cur_stock_own[i]
        elif stock_type[i] == 3:
            temp_invest += cur_stock_price[i] * cur_stock_own[i] * cur_dollarperwon
            temp_btc += cur_stock_price[i] * cur_stock_own[i] * cur_dollarperwon
    temp_invest += cur_global_deposit*cur_dollarperwon + cur_korea_deposit + cur_pension_deposit
    temp_asset = temp_invest + cur_money + cur_housing - cur_debt
    temp_earning = temp_invest - cur_principal
    earning_axis.append(temp_earning)
    asset_axis.append(temp_asset)
    invest_axis.append(temp_invest)
    global_axis.append(temp_global)
    korea_axis.append(temp_korea)
    pension_axis.append(temp_pension)
    btc_axis.append(temp_btc)
    date_axis.append(day_count)
    datetime_axis.append(cur)
    principal_axis.append(cur_principal)
    earning_rate_axis.append(temp_earning/cur_principal*100)
    if day_count%28 == 0:
        for_xaxis.append(day_count)
    day_count += 1
    cur += datetime.timedelta(days=1)

cur = start_date
label_for_xaxis = []
while cur <= now:
    label_for_xaxis.append(cur.strftime('%Y-%m-%d'))
    cur += datetime.timedelta(weeks=4)
plt.figure(figsize=(20,10))
plt.yticks([0, 10000000, 20000000, 30000000, 40000000, 50000000, 60000000, 70000000, 80000000, 90000000, 100000000, 110000000, 120000000], labels=['0', '10,000,000', '20,000,000', '30,000,000', '40,000,000', '50,000,000', '60,000,000', '70,000,000', '80,000,000', '90,000,000', '100,000,000', '110,000,000', '120,000,000'])
plt.xticks(for_xaxis, labels=label_for_xaxis, rotation=60)
plt.plot(date_axis, asset_axis, label='NET ASSET', color='black')
plt.plot(date_axis , earning_axis, label='EARNING', color='red')
plt.plot(date_axis, invest_axis, label='ASSET', linestyle = 'dashed')
plt.plot(date_axis, global_axis, label='GLOBAL', linestyle = 'dashed')
plt.plot(date_axis, korea_axis, label='KOREA', linestyle = 'dashed')
plt.plot(date_axis, pension_axis, label='PENSION', linestyle = 'dashed')
plt.plot(date_axis, btc_axis, label='BTC', linestyle = 'dashed')
max_asset = max(asset_axis)
min_asset = min(asset_axis)
max_asset_index = asset_axis.index(max_asset)
min_asset_index = asset_axis.index(min_asset)
max_earning = max(earning_axis)
min_earning = min(earning_axis)
max_earning_index = earning_axis.index(max_earning)
min_earning_index = earning_axis.index(min_earning)
plt.annotate('{}\n{} {:,}'.format(datetime_axis[max_asset_index].strftime('%Y-%m-%d'), u"\u20A9", int(asset_axis[max_asset_index])), xy=(date_axis[max_asset_index], asset_axis[max_asset_index]), xytext=(-200,70), textcoords='offset points', fontsize=20, ha='center', arrowprops=dict(color='black',arrowstyle="-|>"))
plt.annotate('{}\n{} {:,}'.format(datetime_axis[min_asset_index].strftime('%Y-%m-%d'), u"\u20A9", int(asset_axis[min_asset_index])), xy=(date_axis[min_asset_index], asset_axis[min_asset_index]), xytext=(100,120), textcoords='offset points', fontsize=20, ha='center', arrowprops=dict(color='black',arrowstyle="-|>"))
plt.annotate('{}\n{} {:,}'.format(datetime_axis[-1].strftime('%Y-%m-%d'), u"\u20A9", int(asset_axis[-1])), xy=(date_axis[-1], asset_axis[-1]), xytext=(0,70), textcoords='offset points', fontsize=20, ha='center', arrowprops=dict(color='black',arrowstyle="-|>"))
plt.annotate('{}\n{} {:,}'.format(datetime_axis[max_earning_index].strftime('%Y-%m-%d'), u"\u20A9", int(earning_axis[max_earning_index])), xy=(date_axis[max_earning_index], earning_axis[max_earning_index]), xytext=(0,70), textcoords='offset points', fontsize=20, ha='center', arrowprops=dict(color='red',arrowstyle="-|>"))
plt.annotate('{}\n-{} {:,}'.format(datetime_axis[min_earning_index].strftime('%Y-%m-%d'), u"\u20A9", abs(int(earning_axis[min_earning_index]))), xy=(date_axis[min_earning_index], earning_axis[min_earning_index]), xytext=(0,70), textcoords='offset points', fontsize=20, ha='center', arrowprops=dict(color='red',arrowstyle="-|>"))
plt.annotate('{}\n{} {:,}'.format(datetime_axis[-1].strftime('%Y-%m-%d'), u"\u20A9", int(earning_axis[-1])), xy=(date_axis[-1], earning_axis[-1]), xytext=(0,70), textcoords='offset points', fontsize=20, ha='center', arrowprops=dict(color='red',arrowstyle="-|>"))
print()
print('NET ASSET       : ₩{:,}'.format(int(asset_axis[-1])))
print('MAX NET ASSET   : ₩{:,}'.format(int(max_asset)))
print()
print('EARNING         : ₩{:,}'.format(int(earning_axis[-1])))
print('MAX EARNING     : ₩{:,}'.format(int(max_earning)))
print()
print('RATE OF RETURN  : {:.1f}%'.format(earning_rate_axis[-1]))
plt.legend()
plt.grid(True, axis='y')
plt.savefig('/content/drive/MyDrive/Stock_Record/Asset.png')
old_im = Image.open('/content/drive/MyDrive/Stock_Record/Asset.png')
old_size = old_im.size
new_size = (1440, 1080)
new_im = Image.new("RGB", new_size) ## luckily, this is already black!
new_im.paste(old_im, ((int)((new_size[0]-old_size[0])/2), (int)((new_size[1]-old_size[1])/2)))
new_im.show()
new_im.save('/content/drive/MyDrive/Stock_Record/Asset.png')
bg_color = 'rgb(105,105,105)'
font = ImageFont.truetype('/content/drive/MyDrive/Stock_Record/Monoid-Retina.ttf', 15)
font_color = 'rgb(255,255,255)'
w = 932
h = 699
image = Image.new('RGB', (w,h), color=bg_color)
draw = ImageDraw.Draw(image)
x_text = 165
y_text = 50
lines = []
lines.append('**INVESTMENT STATUS**')
for i in sorted_amount_index:
    if stock_own[i][list(stock_own[i].keys())[-1]] == 0:
        break
    if stock_type[i] == 0:
        lines.append('{}{:10.1f}%{:10.1f}{:15.0f}  {:10.2f}'.format('{0: <10}'.format(ticker[i]), amount[i]/total_amount*100, amount[i], stock_own[i][list(stock_own[i].keys())[-1]], stock_price[i][list(stock_price[i].keys())[-1]]))
    if stock_type[i] == 1 or stock_type == 2:
        lines.append('{}{:10.1f}%{:10.1f}{:15.0f}  {:10.0f}'.format('{0: <10}'.format(ticker[i]), amount[i]/total_amount*100, amount[i], stock_own[i][list(stock_own[i].keys())[-1]], stock_price[i][list(stock_price[i].keys())[-1]]))
    if stock_type[i] == 3:
        lines.append('{}{:10.1f}%{:10.1f}{:15.8f}  {:10.2f}'.format('{0: <10}'.format(ticker[i]), amount[i]/total_amount*100, amount[i], stock_own[i][list(stock_own[i].keys())[-1]], stock_price[i][list(stock_price[i].keys())[-1]]))
for line in lines:
    width, height = font.getsize(line)
    draw.text((x_text,y_text),line,font=font,fill=font_color)
    y_text += height+10
image.save('/content/drive/MyDrive/Stock_Record/Investment_Status.png')
image
w = 600
h = 450
image1 = Image.new('RGB', (w,h), color=bg_color)
draw1 = ImageDraw.Draw(image1)
x_text = 50
y_text = 50
lines = []
lines.append('**SUMMARY**')
lines.append('GLOBAL STOCK     : {:.1f}%    ${:.1f}     {}'.format(amount_by_type[0]/total_amount_plus_deposit*100, amount_by_type[0], '{:,}'.format(int(amount_by_type[0]*dollarperwon))))
lines.append('KOREA  STOCK     : {:.1f}%    ${:.1f}     {}'.format(amount_by_type[1]/total_amount_plus_deposit*100, amount_by_type[1], '{:,}'.format(int(amount_by_type[1]*dollarperwon))))
lines.append('PENSION S. FUND  : {:.1f}%     ${:.1f}       {}'.format(amount_by_type[2]/total_amount_plus_deposit*100, amount_by_type[2], '{:,}'.format(int(amount_by_type[2]*dollarperwon))))
lines.append('CRYPTOCURRENCY   : {:.1f}%     ${:.1f}       {}'.format(amount_by_type[3]/total_amount_plus_deposit*100, amount_by_type[3], '{:,}'.format(int(amount_by_type[3]*dollarperwon))))
lines.append('TOTAL ASSET      : 100%     ${:.1f}    {}'.format(total_amount_plus_deposit, '{:,}'.format(int(total_amount_plus_deposit*dollarperwon))))
lines.append('')
lines.append('NET ASSET       : {:,}'.format(int(asset_axis[-1])))
lines.append('MAX NET ASSET   : {:,}'.format(int(max_asset)))
lines.append('')
lines.append('EARNING         : {:,}'.format(int(earning_axis[-1])))
lines.append('MAX EARNING     : {:,}'.format(int(max_earning)))
lines.append('')
lines.append('RATE OF RETURN  : {:.1f}%'.format(earning_rate_axis[-1]))
for line in lines:
    width, height = font.getsize(line)
    draw1.text((x_text,y_text),line,font=font,fill=font_color)
    y_text += height+10
image1.save('/content/drive/MyDrive/Stock_Record/Summary.png')
image1
Hello Everything!