1. 헬름 레포지토리 추가
helm repo add prometheus-community https://prometheus-community.github.io/helm-charts
helm repo add grafana https://grafana.github.io/helm-charts
helm repo update
2. 그라파나와 프로메테우스 배포
mkdir grafana_prometheus
cd grafana_prometheus
헬름 배포를 위한 values.yaml 작성할 디렉터리 생성
cat << EOF > values-prometheus.yamlvalues-prometheus.yaml
server:
  enabled: true


  persistentVolume:
    enabled: true
    accessModes:
      - ReadWriteOnce
    mountPath: /data
    size: 100Gi
  replicaCount: 1

  retention: "15d" #프로메테우스 데이터 보유 기간
cat << EOF > values-grafana.yamlvalues-grafana.yaml
replicas: 1

service:
  type: LoadBalancer

persistence:
  type: pvc
  enabled: true
  # storageClassName: default
  accessModes:
    - ReadWriteOnce
  size: 10Gi
  # annotations: {}
  finalizers:
    - kubernetes.io/pvc-protection
adminUser: admin
adminPassword: test1234
3. 헬름차트 배포(프로메테우스, 그라파나)
kubectl create ns prometheus
helm install prometheus prometheus-community/prometheus -f values-prometheus.yaml -n prometheus
helm install grafana grafana/grafana -f values-grafana.yaml -n prometheus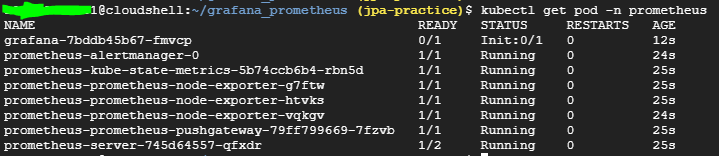

4. 그라파나 접속
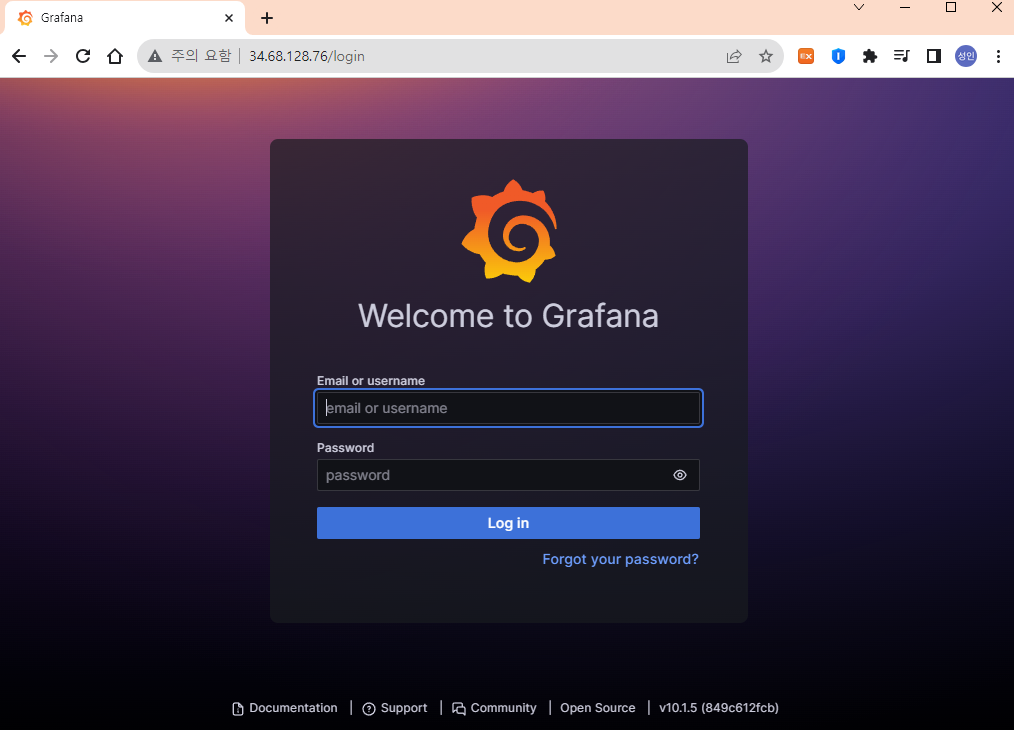
앞서 설정했던 admin 로그인 정보로 로그인하기
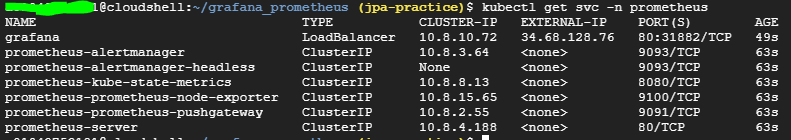
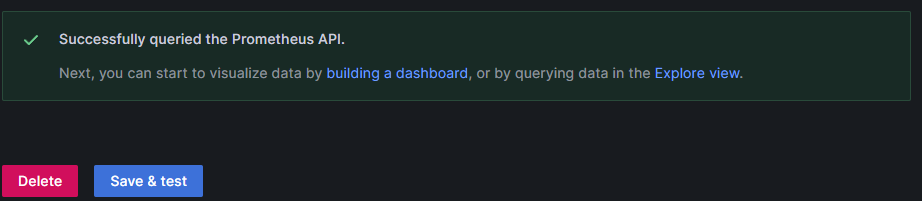
5. 프로메테우스를 Data Sources에 등록하기
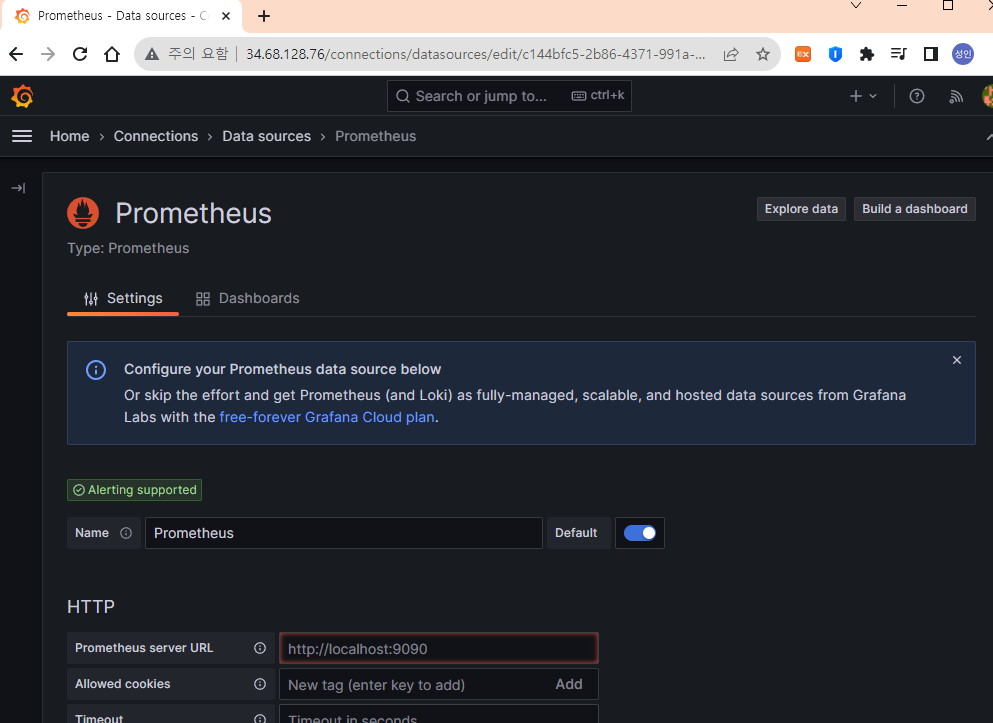
URL에 ClusterIP 이름을 넣으면 됨. (prometheus-server) , 네임스페이스다르면 또 설정해줘야햄
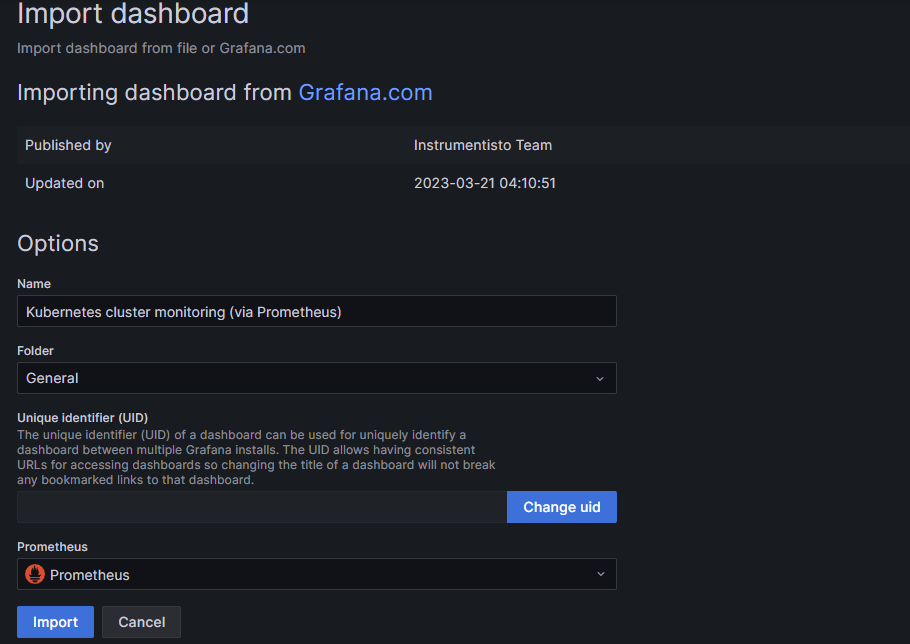
6. 대시보드 import
https://grafana.com/grafana/dashboards/7550-kubernetes-cluster-monitoring-prometheus/
- DashBoard -> New -> Import -> grafana에서 찾은 대시보드 ID 입력
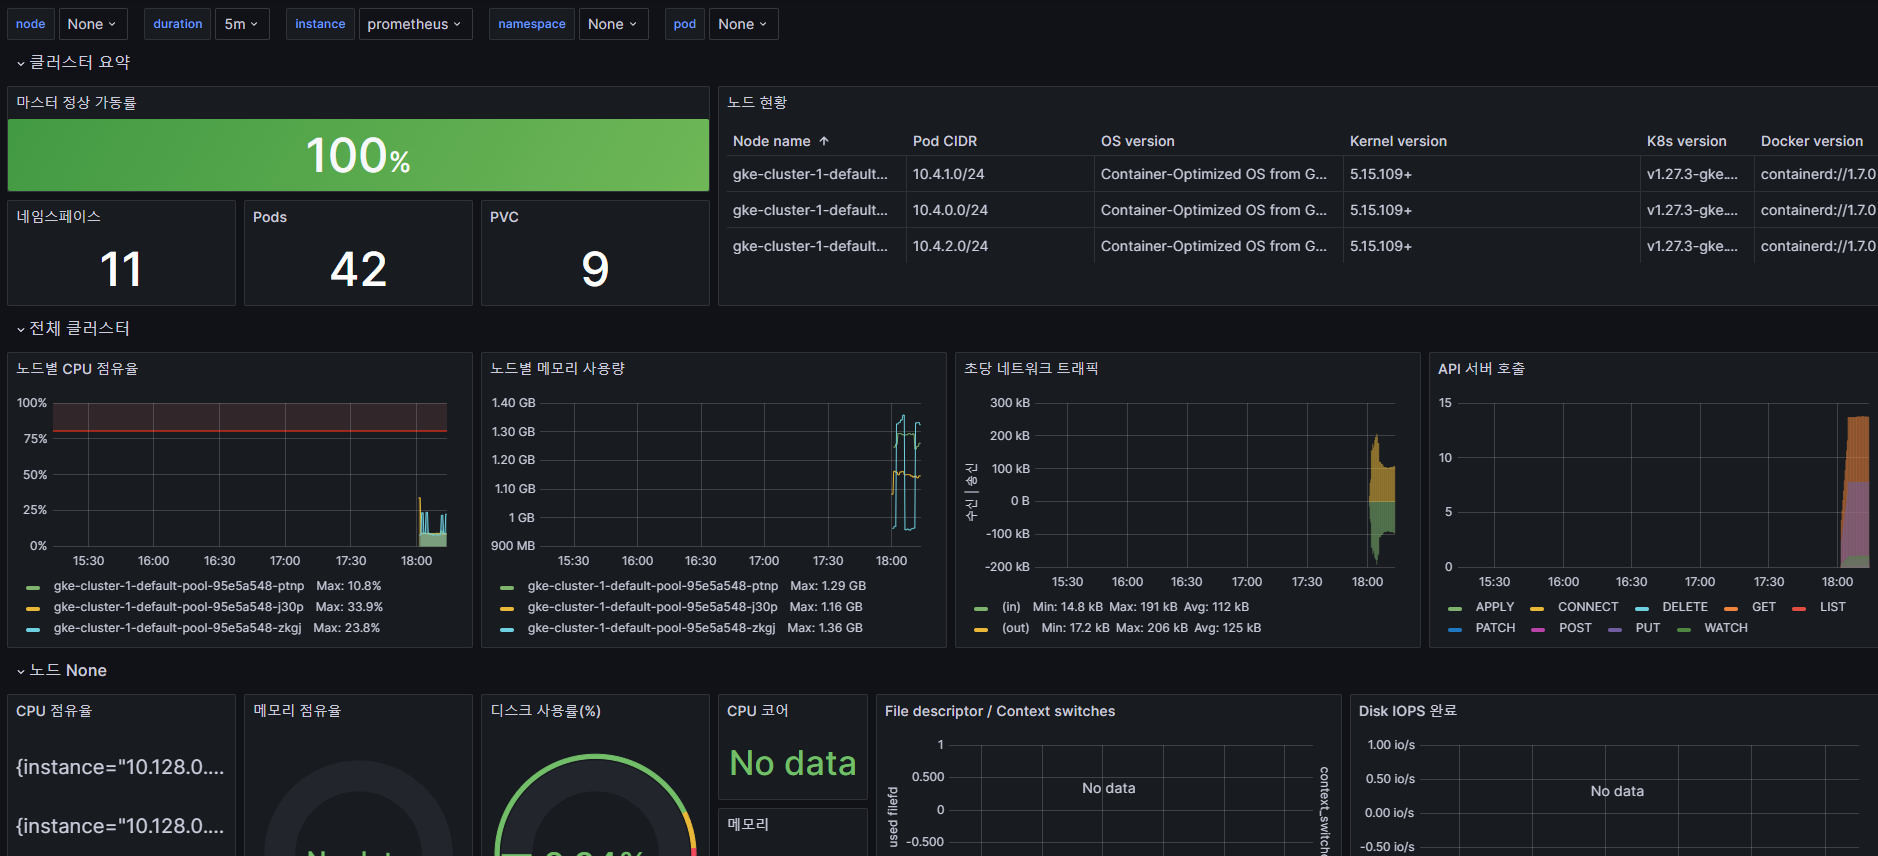
7. 대시보드 활용
315번 대시보드
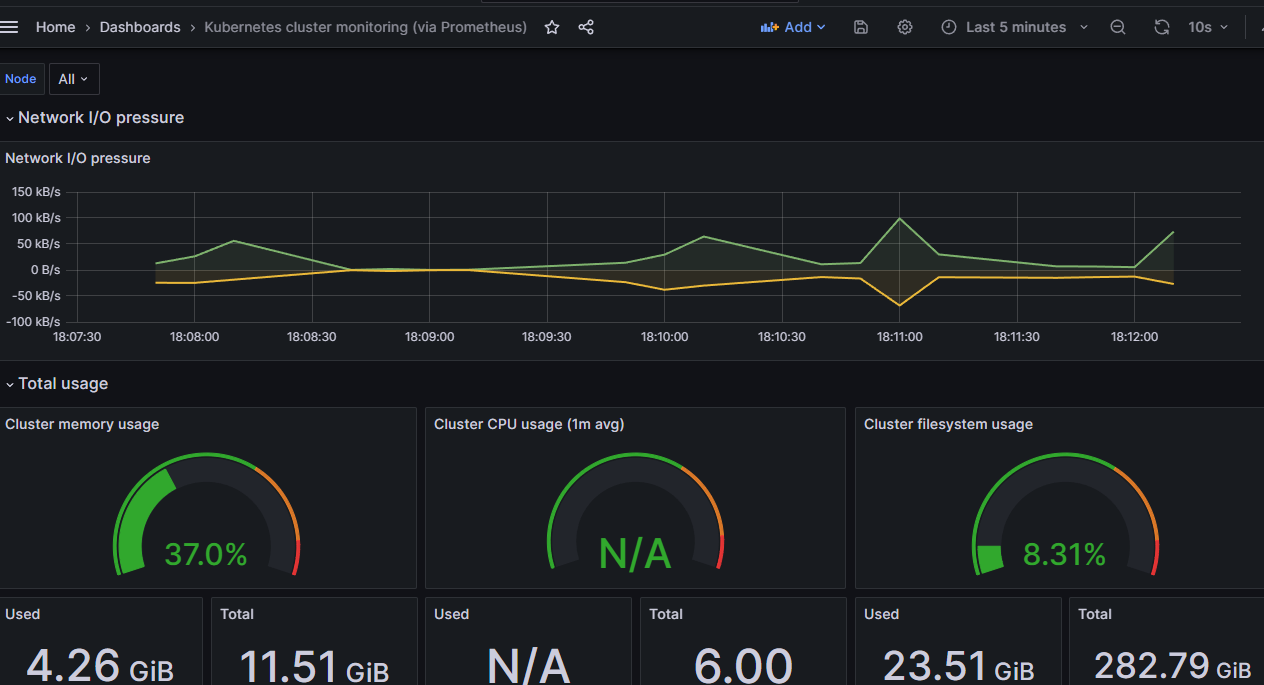
13770 대시보드