AlertManager
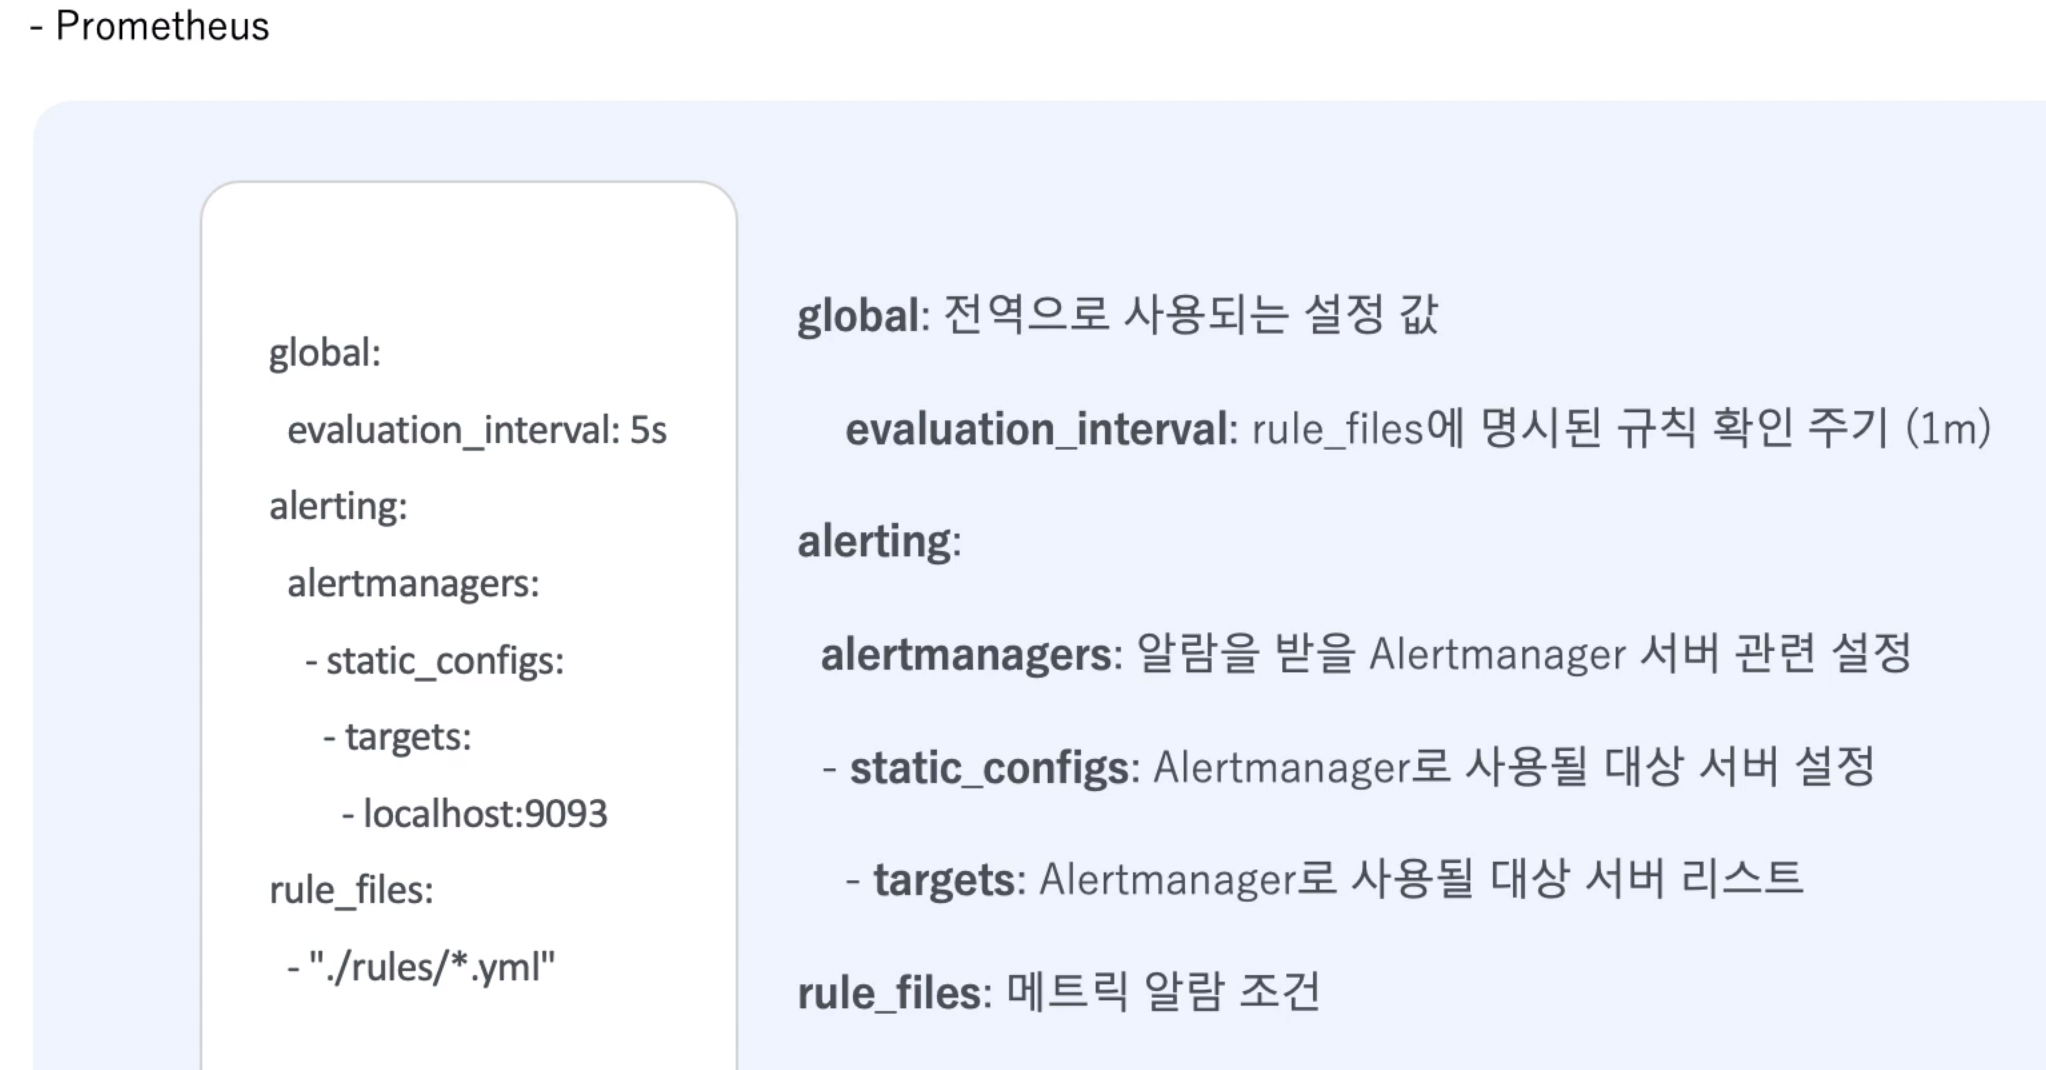
Prometheus 관련 설정
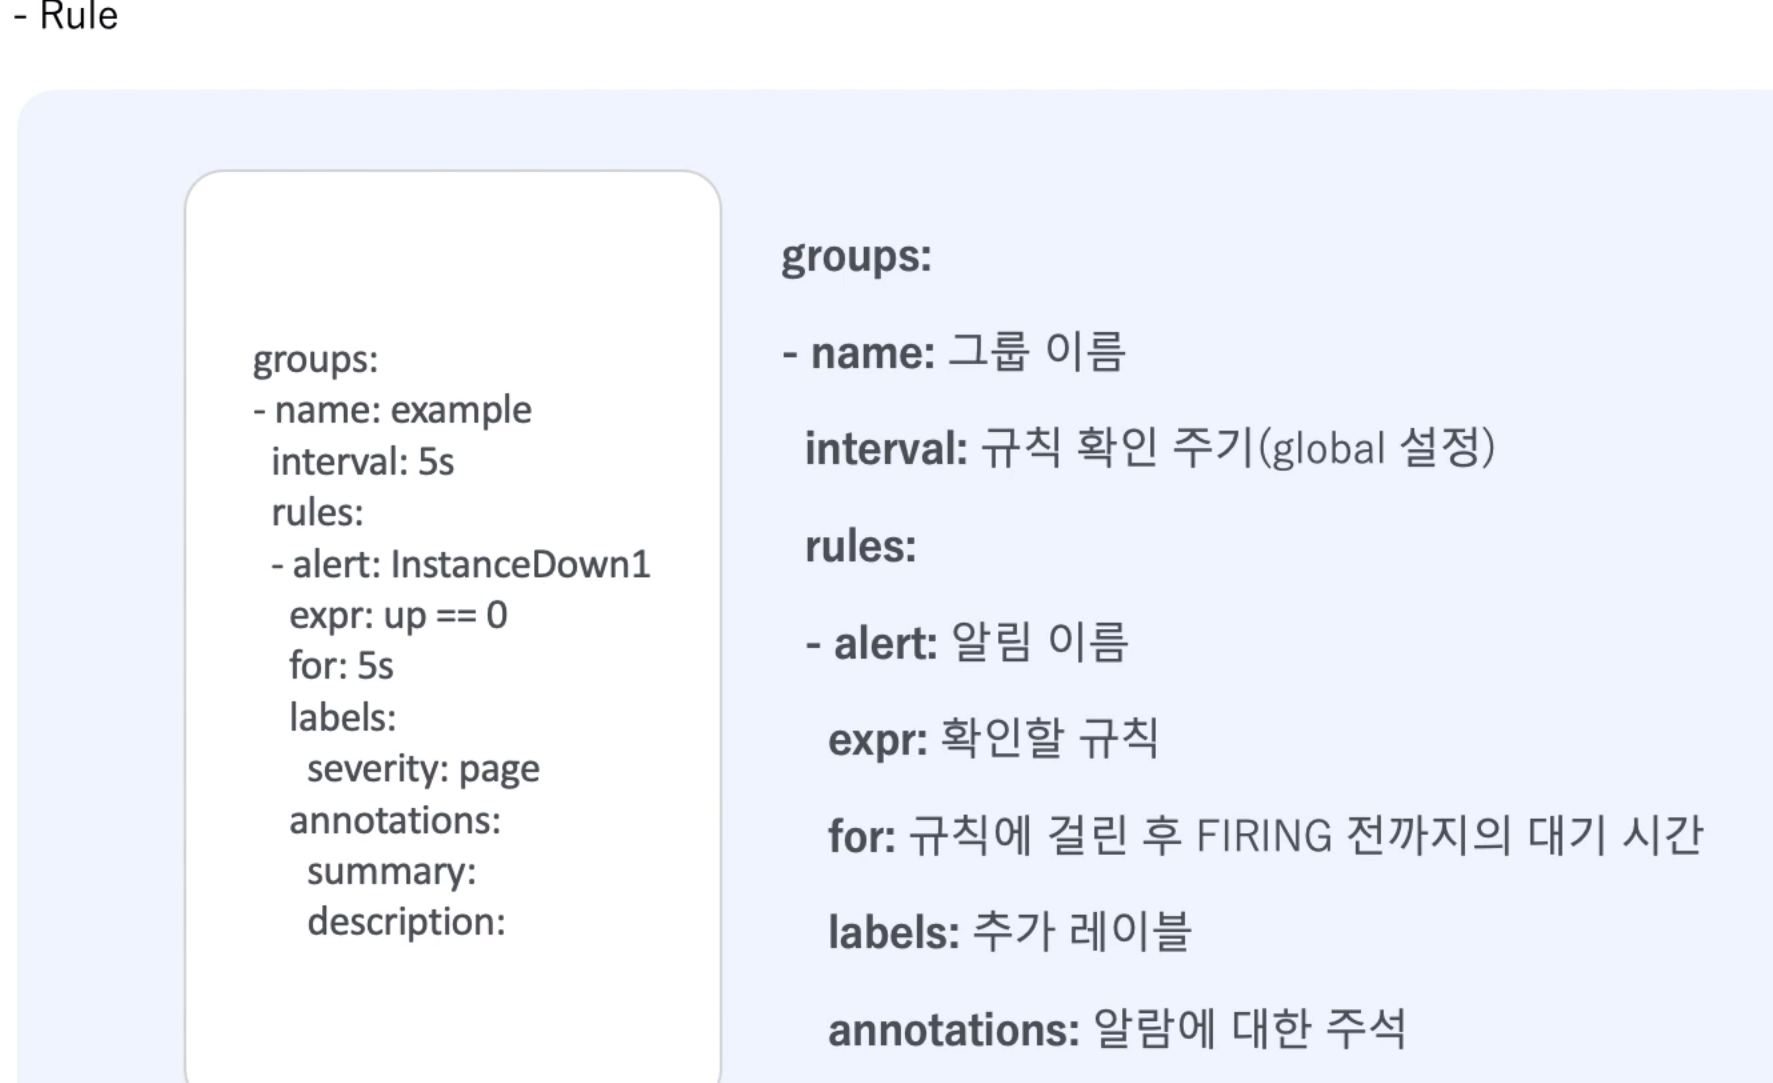
Rule 관련 설정
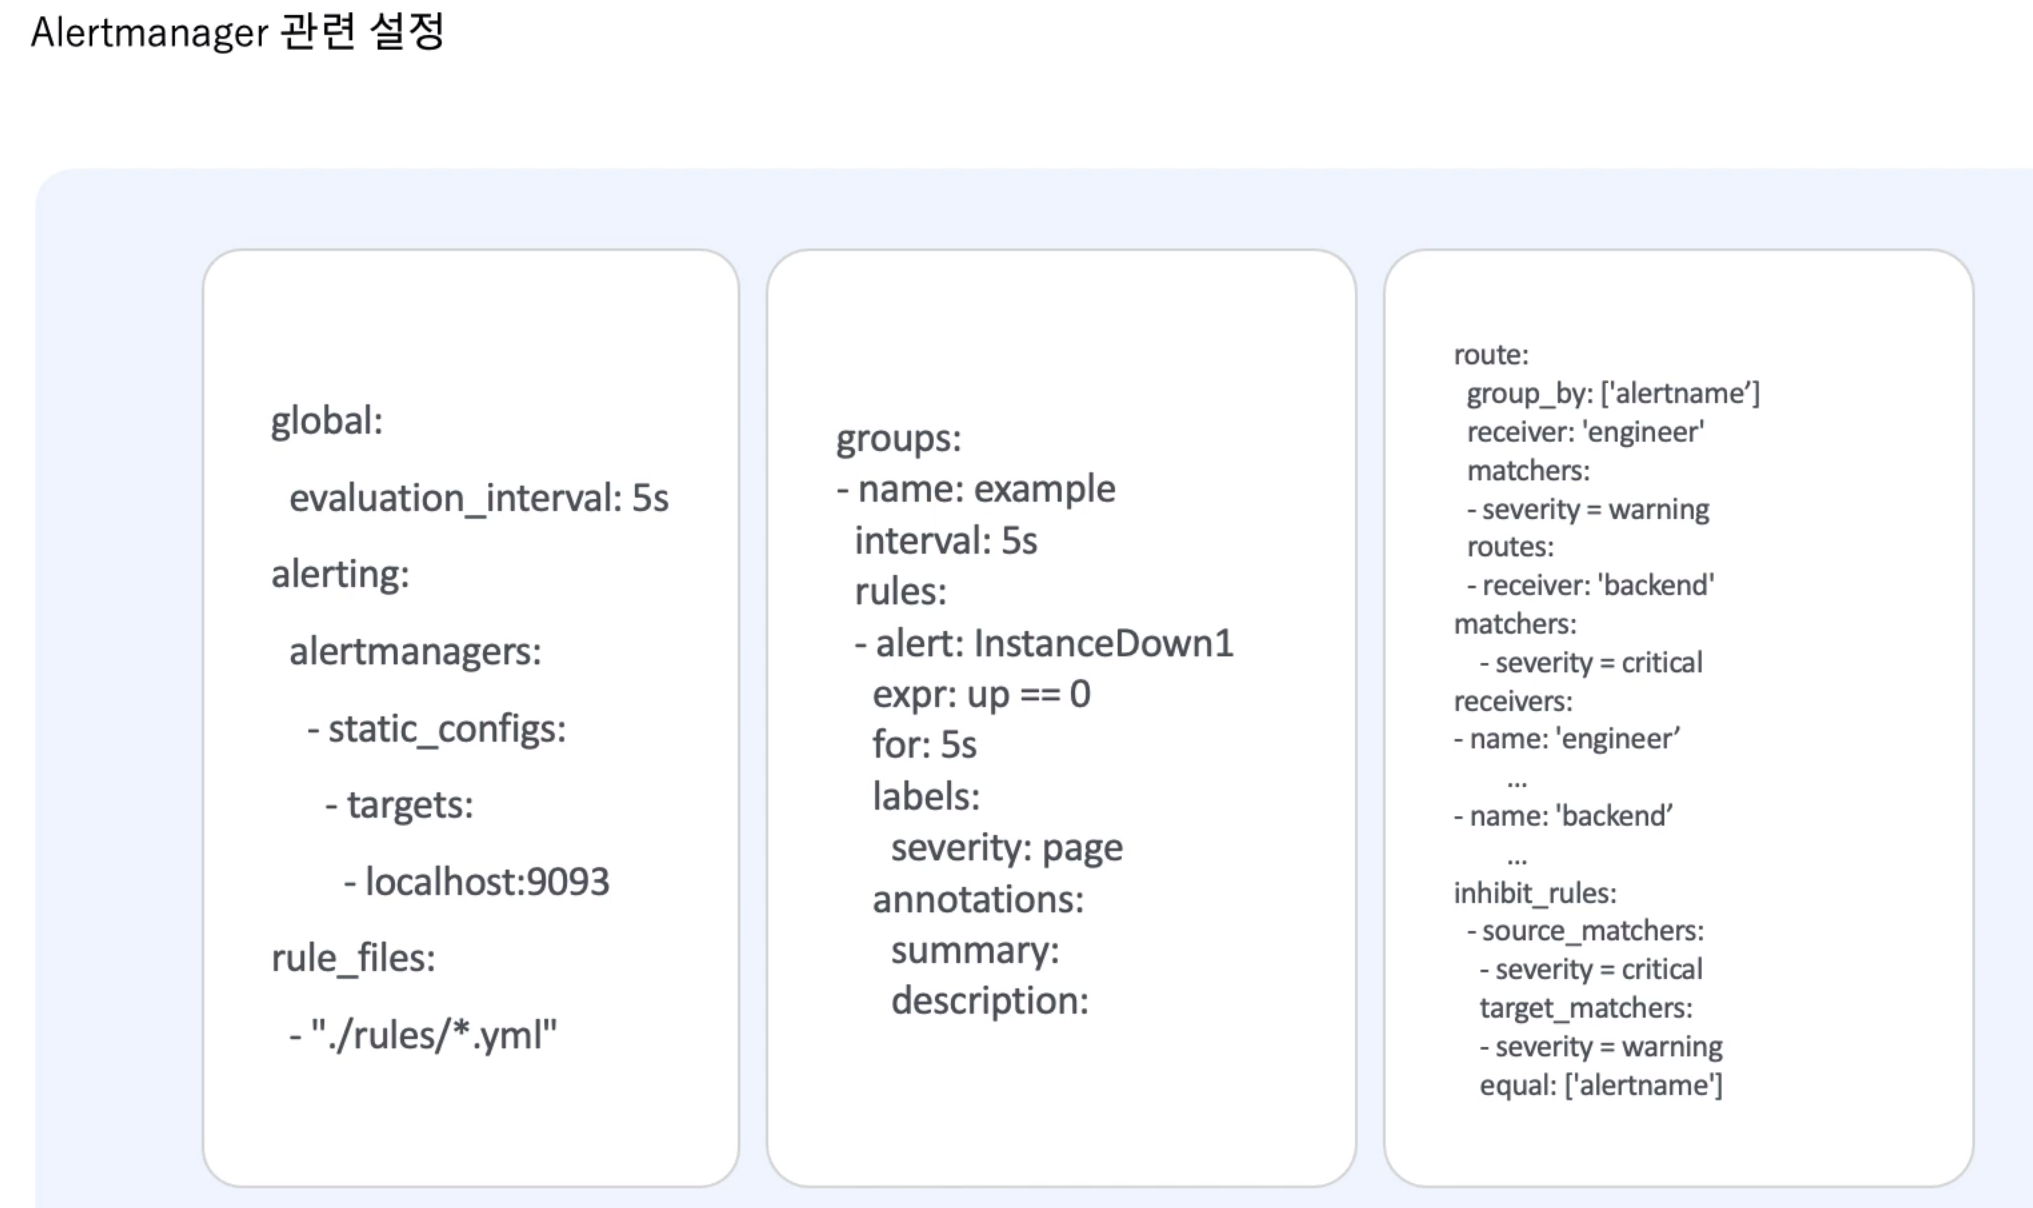
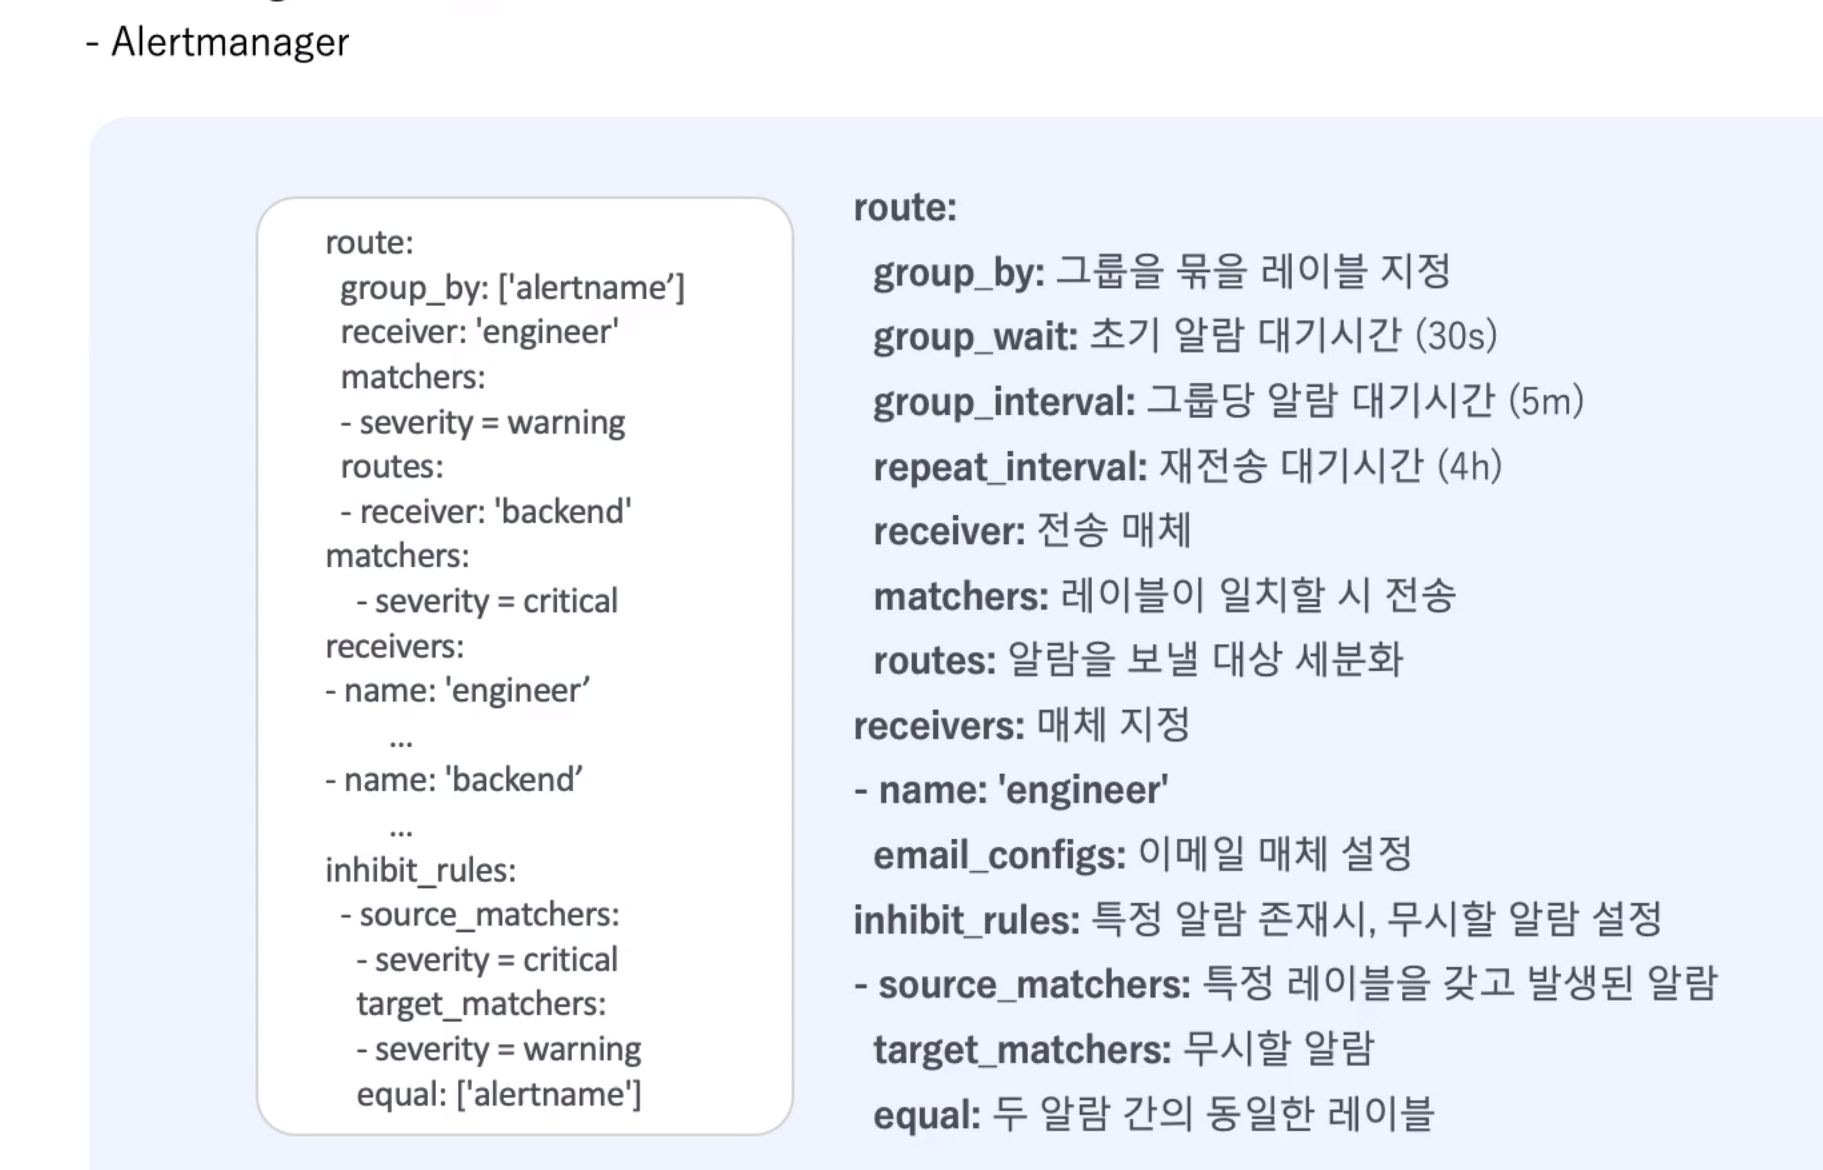
Alertmanager 설정
- vim alerting.yml
global:
    evaluation_interval: 1s

alerting:
  alertmanagers:
  - static_configs:
    - targets:
      - localhost:9093

rule_files:
- "./rules/*.yml"

scrape_configs:
- job_name: 'node_exporter'
  scrape_interval: 3s
  scrape_timeout: 1s
  static_configs:
  - targets:
      - localhost:9100
[참고]
https://awesome-prometheus-alerts.grep.to/rules
각 Exporter에 맞는 rule 제공
- vim ~/etc/prometheus/rules/ex.yml


groups:
- name: example
  rules:
  - alert: InstanceDown
    expr: up == 0
    for: 10s
    labels:
      severity: critical
    annotations:
      summary: "Instance {{ $labels.instance }} down"
localhost:9090/alerts 에서 확인
-
node exporter 다운
systemctl stop node_exporter -
inactive 상태 확인
처음 10초동안은 pending 상태
그 후엔 Firing 으로 변경 됨. ( 이 상태에서 alarm 메일을 보내게 됨)
alertmanager 설치
mkdir -p /alertmanager/config
alertmanager 실행
docker run --net=host --name alertmanager -d \
-v /alertmanager/config:/etc/alertmanager quay.io/prometheus/alertmanager
alertmanager 설정
- /alertmanager/config/vim alertmanager.yml


route:
  group_by: ['alertname']
  group_wait: 3s
  group_interval: 5s
  repeat_interval: 20s
  receiver: 'engineer'

receivers:
- name: 'engineer'
  email_configs:
  - to: ekdma1403@gmail.com
    from: ekdma1403@gmail.com
    smarthost: smtp.gmail.com:587
    auth_username: ekdma1403@gmail.com
    auth_password: "google 앱비밀번호"
alertmanager 재실행
docker rm -f alertmanagerdocker run --net=host --name alertmanager -d \
-v /alertmanager/config:/etc/alertmanager quay.io/prometheus/alertmanagerprometheus docker 재시작
docker rm -f prometheus
docker run \
-d --name=prometheus \
--net=host \
-v /prometheus/config:/etc/prometheus \
-v /prometheus/data:/data \
prom/prometheus:v2.29.2 \
--config.file=/etc/prometheus/prometheus.yml \
--storage.tsdb.path=/data \
--web.enable-lifecycle \
--storage.tsdb.retention.time=20d \
--log.level=debug \
--rules.alert.resend-delay=10s

// 테스트를 위해서 delay 값 10초로 셋팅
알람 확인 방법 (TCP DUMP)
tcpdump -i lo -A 'tcp port 9093'
-
Swagger 양식 : https://github.com/prometheus/alertmanager/blob/main/api/v2/openapi.yaml
-
Swagger 에디터로 확인
https://editor.swagger.io/ 에 swagger 양식 복사 붙여넣기
curl -X 'POST' \
  'http://localhost:9093/api/v2/alerts' \
  -H 'accept: application/json' \
  -H 'Content-Type: application/json' \
  -d '[
  {
    "startsAt": "2022-11-03T14:10:24.181Z",
    "endsAt": "2022-11-04T14:10:24.181Z",
    "annotations": {
      "summary": "test"
    },
    "labels": {
      "alertname": "test"
    }
  }
]'
-
localhost:9093/alerts 에서 알람 생겼는지 확인 하기
alertmanager.yml 에 추가
inhibit_rules:
- source_matchers:
  - severity = critical
  target_matchers:
  - severity = warning
  equal: ['alertname']
- API 재실행
curl -X 'POST' \
  'http://localhost:9093/api/v2/alerts' \
  -H 'accept: application/json' \
  -H 'Content-Type: application/json' \
  -d '[
  {
    "startsAt": "2022-11-03T14:10:24.181Z",
    "endsAt": "2022-11-04T14:10:24.181Z",
    "annotations": {
      "summary": "test"
    },
    "labels": {
      "alertname": "MemoryShortage", "severity": "warning"
    }
  }
]'-
"severity": "warning" -> "critical" 바꿔서 테스트 하기
-
localhost:9093/alerts 에서 critical로 바뀌었는지 확인,
상단에 inhibited 를 누르면 무시설정 해논 알람 체크 가능 -
메일을 확인 해보면 무수한 알람이 와있을 것이다. silenced 설정을 하면 알람을 중지 시킬 수 있다.