❓ why) pre-process data?
정확성, 완전성, 일관성, 적시성, 신뢰성, 해석가능성 등
Overview
❑Data cleaning → 채우기, 노이즈 없애기
❑Data integration → 多 DB, file 등에서 합치기
❑Data reduction → 차원 축소, 수 감소, 압축
❑Data transformation and data discretization → 정규화, 계층 생성?
1 Data Cleaning (데이터 정화)
🥲 pb) 실세계의 데이터는 Dirty하다.
- Incomplete
- feature value가 부족하다. (missing data)
- Noisy
- noise, outlier, error
- Inconsitent e.g. age = “42”, birthdayt = “03.07.2000”
| 1. Missing(Incomplete) Data | 2. Noisy (Incorrect) Data | 3. Inconsistent Data | |
|---|---|---|---|
| sol) | - Remove (missing value가 너무 많으면 효과적이지 않다.) - Fill manually - Fill automatically (constant, mean, inferred value 등) | outlier detection 이 필요하다. | human inspection이 필요하다. |
2 Data Integration (데이터 통합)
☑️ what) 여러 source (DB, File 등) 에 있는 데이터셋을 결합한다.
- Schema integration
- Detecting and resolving data value conflicts (e.g. cm vs. inch)
🥲 pb. Redundancy
데이터 통합 과정에서, derivable data가 발생할 수 있다.
e.g. birthday & age
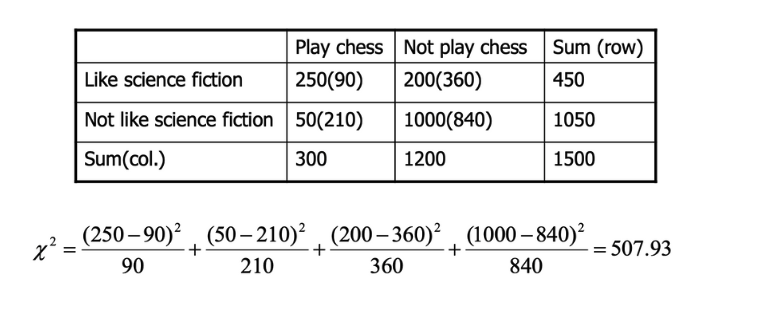
sol1. Correlation Analysis
1) Chi-Square (for nominal features)
大 → correlated, dependent → remove 可
小 (0) → independent
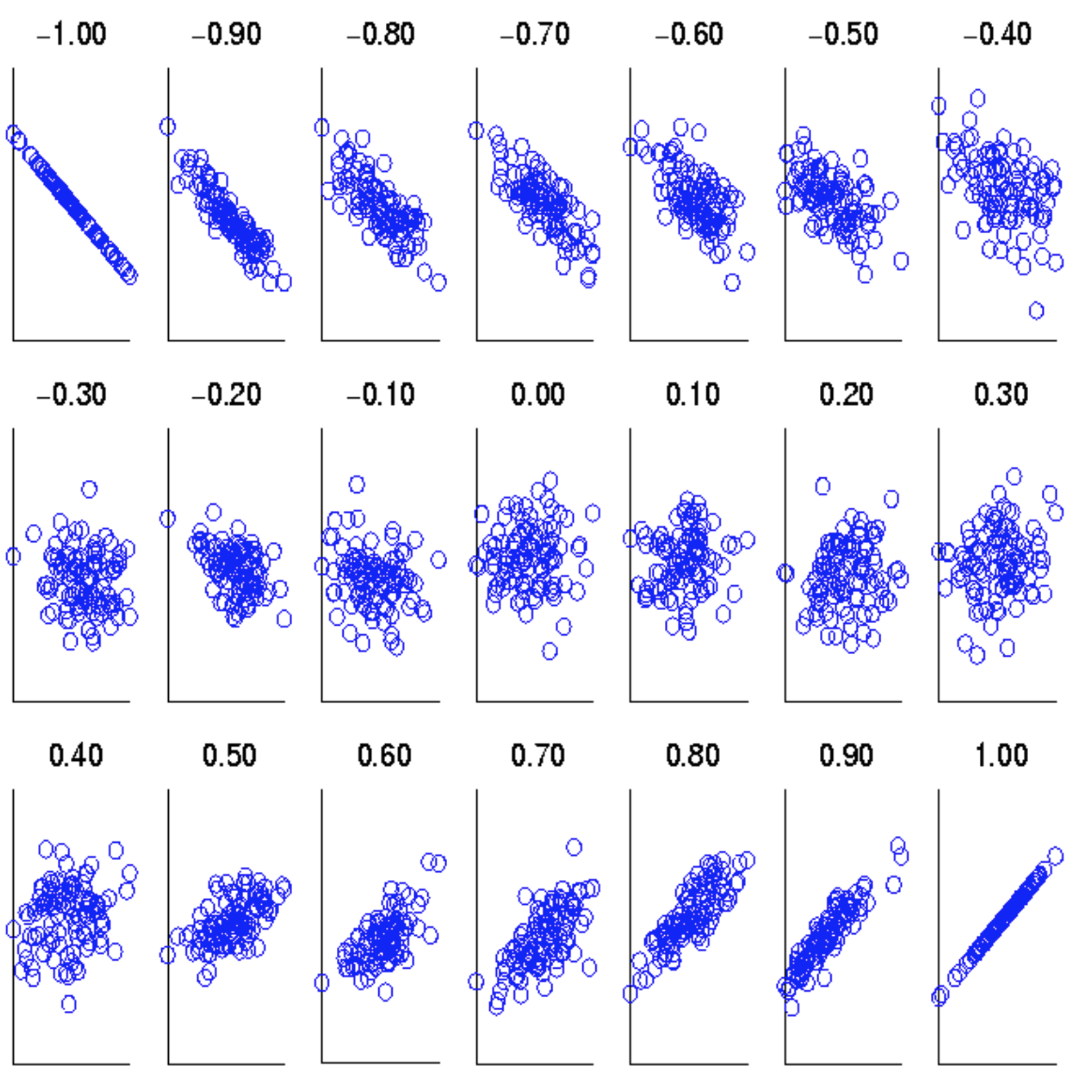
2) PCC (Pearson’s Correlation Coefficient) (for numeric features)
r > 0 → positively correlated
r = 0 → independent
r < 0 → negatively correlated
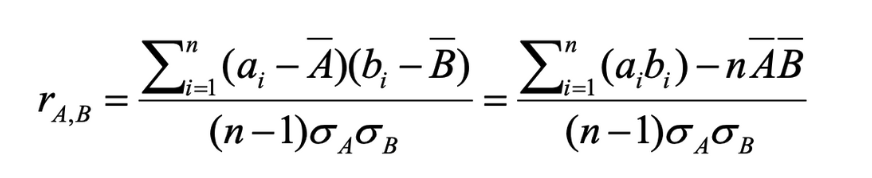
where
: means of A and B
: standard deviation of A and B
: sum of AB cross product
sol2. Covariance Analysis (for numeric feature)
Cov(A,B) > 0 → A, B가 둘 다 평균보다 큰 경향
Cov(A,B) = 0 → indepedent
Cov(A,B) < 0 → A가 크면, B는 더 작은 경향
3 Data Reduction (데이터 축소)
❓ why) reduce data?
데이터의 사이즈가 너무나 크다. 복잡한 데이터는 분석에 시간이 많이 소요될 수 있다.
1. Dimensionality Reduction (컬럼 단위)
👍🏻 gd) 차원의 저주를 피할 수 있다. 관계 없는 feature를 제거할 수 있다. 더 쉬운 시각화
how) mathemathical(PCA), heristical(Correlation Analysis)
1) PCA (Principle Components Analysis)
☑️ what) 주어진 데이터의 variation이 가장 큰 (==정보의 표현성이 가장 큰) 새로운 차원을 찾는다.
👍🏻 gd) 정보의 소실이 있을 수 있지만, 데이터 차원을 줄여준다.
numeric data에만 적용할 수 잇다.
2) Featrue Selection
- redundat 제거
- irrelevant 제거
how) optimal 한 개의 피쳐를 고르려면 의 시간이 필요하다. -> infeasible
approximation을 사용한다. 각각의 feature의 독립을 가정하고, one-by-one으로 고른다.
2. Numerosity Reduction (로우 단위)
- parametric regression
- non-parametric clustering, sampling, ...
1) Regression
parameter인 만 저장된다.
👍🏻 gd) 한 컬럼이 아닌 소수의 매개변수만 저장하여 데이터를 축소한다.
2) Clustering
clustring representation (centroid, diameters ...) 만 저장된다.
🥲 pb) data smeared (번짐)
3) Sampling ; Stratified Sampling
☑️ what) 데이터셋을 나누고, proportionally 파티션에서 샘플링한다.
4 Data Transformation and Data Discretization
☑️ what) 데이터를 새로운 범위, 새로운 범주로 매핑하는 것
1. Normalization
❓ why) 스케일이 다르면 데이터가 의미 없게 취급될 수 있음. e.g. age 1_100, scale 50~100000 -> age 무시
1) Z-Score 정규화
z < 0 -> below the mean
z > 0 -> above the mean
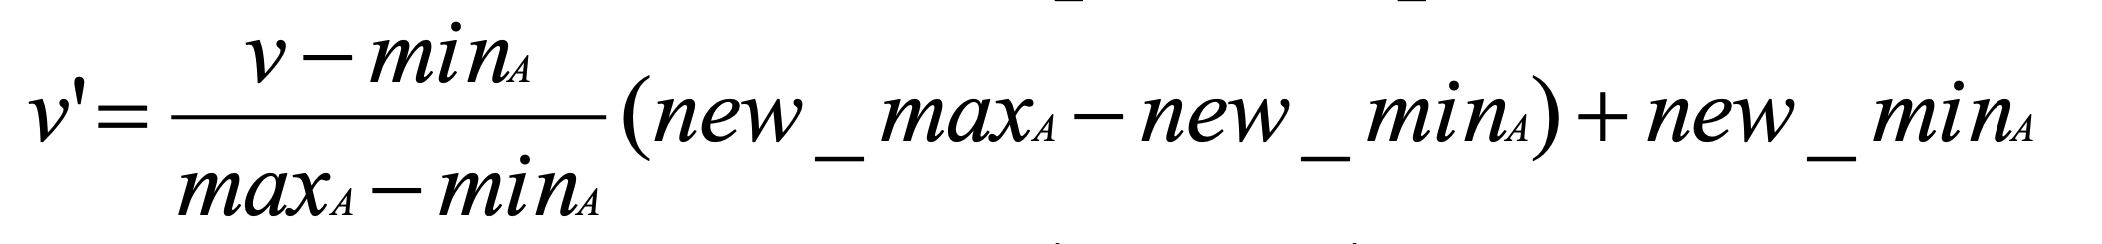
2) Min-Max 정규화
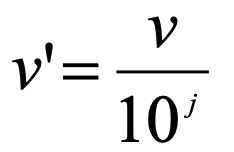
3) Decimal Scaling 정규화
2. Discretization
☑️ what) numeric 피쳐의 범위를 나누는 것
비슷한 값은 같은 의미를 갖게 된다.
1) Binning
- Equal-width partitioning (같은 범위)
pb) outlier - Equal-depth partitioning (같은 개수)